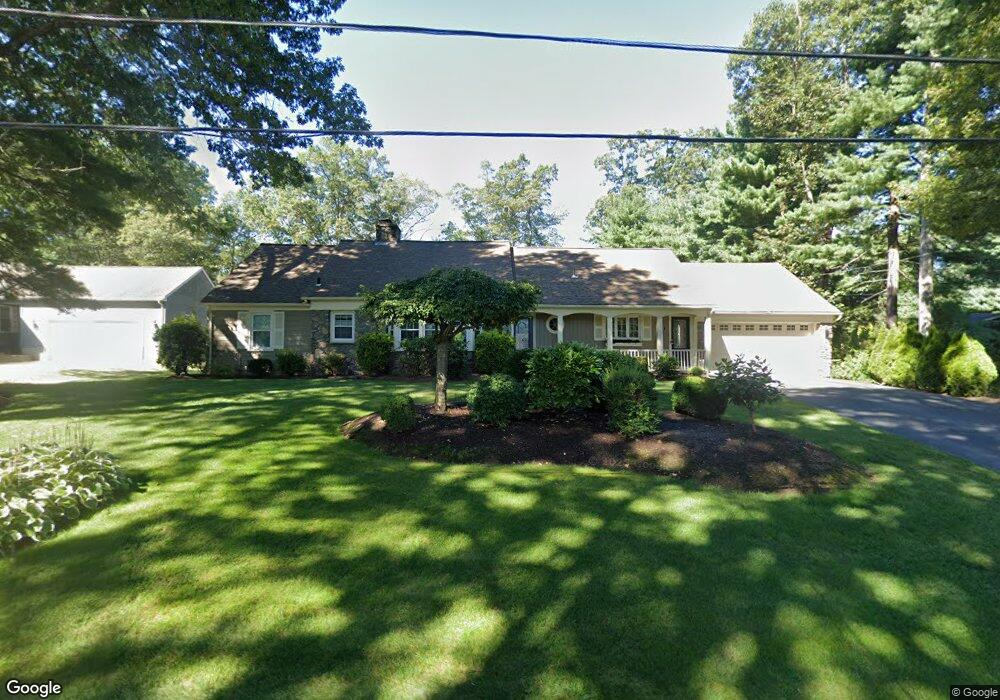
9 Maplecrest Dr Greenville, RI 02828
Bishop Heights NeighborhoodEstimated Value: $642,000 - $785,000
3
Beds
2
Baths
1,941
Sq Ft
$361/Sq Ft
Est. Value
About This Home
This home is located at 9 Maplecrest Dr, Greenville, RI 02828 and is currently estimated at $700,453, approximately $360 per square foot. 9 Maplecrest Dr is a home located in Providence County with nearby schools including William Winsor Elementary School, Vincent J. Gallagher Middle School, and Smithfield High School.
Ownership History
Date
Name
Owned For
Owner Type
Purchase Details
Closed on
Jun 26, 2025
Sold by
Annunziata Brittany L
Bought by
Annunziata Family Relt and Annunziata
Current Estimated Value
Purchase Details
Closed on
Dec 2, 2024
Sold by
Annunziata Family Relt and Black
Bought by
Annunziata Brittany L
Purchase Details
Closed on
Oct 3, 2018
Sold by
Annunziata Eric P and Annunziata Carol A
Bought by
Annuziata Ft and Annunziata
Purchase Details
Closed on
Nov 25, 1998
Sold by
Ashton Catherine D
Bought by
Annunziata Eric and Annunziata Carol
Create a Home Valuation Report for This Property
The Home Valuation Report is an in-depth analysis detailing your home's value as well as a comparison with similar homes in the area
Home Values in the Area
Average Home Value in this Area
Purchase History
| Date | Buyer | Sale Price | Title Company |
|---|---|---|---|
| Annunziata Family Relt | -- | -- | |
| Annunziata Family Relt | -- | -- | |
| Annunziata Family Relt | -- | -- | |
| Annunziata Brittany L | -- | None Available | |
| Annunziata Brittany L | -- | None Available | |
| Annunziata Brittany L | -- | None Available | |
| Annunziata Brittany L | -- | None Available | |
| Annuziata Ft | -- | -- | |
| Annuziata Ft | -- | -- | |
| Annunziata Eric | $165,000 | -- | |
| Annuziata Ft | -- | -- | |
| Annunziata Eric | $165,000 | -- |
Source: Public Records
Mortgage History
| Date | Status | Borrower | Loan Amount |
|---|---|---|---|
| Previous Owner | Annunziata Eric | $25,000 | |
| Previous Owner | Annunziata Eric | $264,000 |
Source: Public Records
Tax History Compared to Growth
Tax History
| Year | Tax Paid | Tax Assessment Tax Assessment Total Assessment is a certain percentage of the fair market value that is determined by local assessors to be the total taxable value of land and additions on the property. | Land | Improvement |
|---|---|---|---|---|
| 2025 | $8,309 | $670,600 | $168,800 | $501,800 |
| 2024 | $6,899 | $477,800 | $143,300 | $334,500 |
| 2023 | $6,555 | $477,800 | $143,300 | $334,500 |
| 2022 | $6,383 | $477,800 | $143,300 | $334,500 |
| 2021 | $6,359 | $371,200 | $130,200 | $241,000 |
| 2020 | $6,240 | $371,200 | $130,200 | $241,000 |
| 2019 | $6,240 | $371,200 | $130,200 | $241,000 |
| 2018 | $5,742 | $327,000 | $115,700 | $211,300 |
| 2017 | $5,475 | $311,800 | $115,700 | $196,100 |
| 2016 | $5,422 | $324,100 | $115,700 | $208,400 |
| 2015 | $5,065 | $288,300 | $109,700 | $178,600 |
| 2012 | $5,038 | $314,500 | $128,300 | $186,200 |
Source: Public Records
Map
Nearby Homes
- 494 Putnam Pike Unit A12
- 494 Putnam Pike Unit A1
- 936 Greenville Ave
- 563 Putnam Pike
- 2 Hattie Ave
- 965 Greenville Ave
- 13 Willow Rd
- 36 Cedar Swamp Rd
- 5 Pleasant View Cir
- 14 Douglas Cir
- 56 Pleasant View Ave
- 28 Lakeview Dr
- 7 Apple Valley Pkwy Unit 8
- 2 Fairview Dr
- 3 Juniper Ln
- 18 Shady Brook Cove Rd
- 100 Mountaindale Rd
- 62 Orchard Ave
- 66 Orchard Ave
- 99 Indian Run Trail
- 11 Maplecrest Dr
- 7 Maplecrest Dr
- 15 Maplecrest Dr
- 12 Maplecrest Dr
- 22 Whispering Pine Terrace
- 11 Whispering Pine Terrace
- 18 Whispering Pine Terrace
- 24 Whispering Pine Terrace
- 14 Maplecrest Dr
- 0 Whispering Pine Terrace
- 48 Maplecrest Dr
- 17 Maplecrest Dr
- 9 Whispering Pine Terrace
- 5 Maplecrest Dr
- 46 Maplecrest Dr
- 46 Maple Crest Dr
- 26 Whispering Pine Terrace
- 11 Hillcrest Ave
- 9 Hillcrest Ave
- 15 Hillcrest Ave