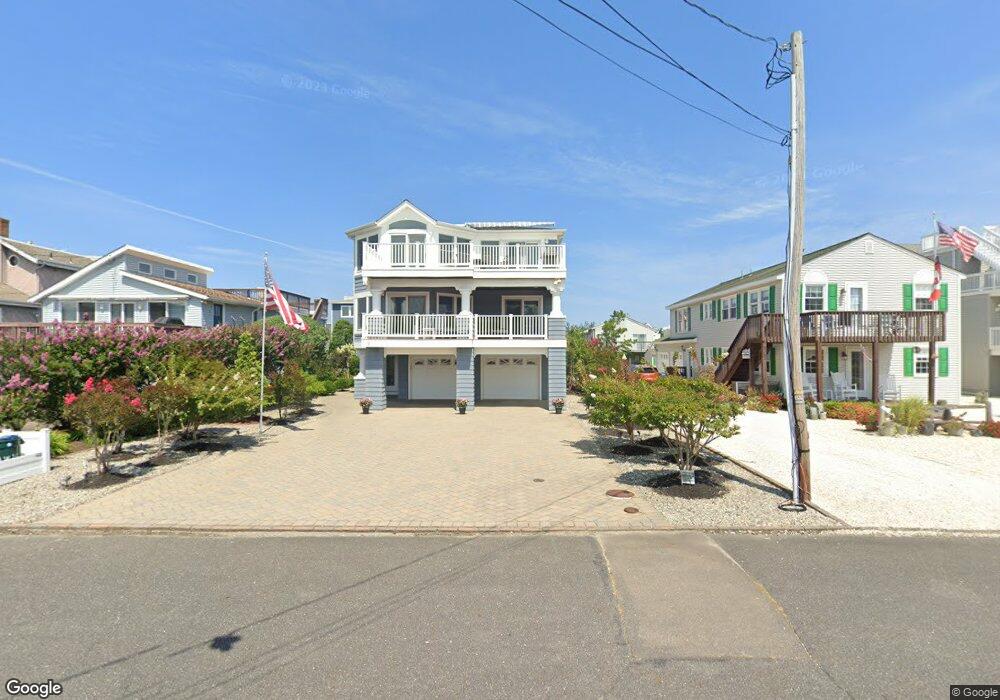
9 W 26 St Barnegat Light, NJ 08006
Long Beach Island NeighborhoodEstimated Value: $1,166,000 - $2,156,000
4
Beds
5
Baths
4,542
Sq Ft
$403/Sq Ft
Est. Value
About This Home
This home is located at 9 W 26 St, Barnegat Light, NJ 08006 and is currently estimated at $1,828,540, approximately $402 per square foot. 9 W 26 St is a home with nearby schools including Ethel A. Jacobsen Elementary School, Long Beach Island Grade School, and Southern Regional Middle School.
Ownership History
Date
Name
Owned For
Owner Type
Purchase Details
Closed on
Jul 29, 2009
Sold by
Sauma Sami
Bought by
Sauma Sami Y and Sami Y Sauma 2009 Qualified Personal Res
Current Estimated Value
Purchase Details
Closed on
Feb 13, 2008
Sold by
Bakely Herbert E and Giberson Ruth K
Bought by
Sauma Sami
Purchase Details
Closed on
Sep 26, 2005
Sold by
Bakely Herbert E
Bought by
Bakely Herbert E
Create a Home Valuation Report for This Property
The Home Valuation Report is an in-depth analysis detailing your home's value as well as a comparison with similar homes in the area
Home Values in the Area
Average Home Value in this Area
Purchase History
| Date | Buyer | Sale Price | Title Company |
|---|---|---|---|
| Sauma Sami Y | -- | None Available | |
| Sauma Sami | $530,000 | Commonwealth Land Title Insu | |
| Bakely Herbert E | -- | -- |
Source: Public Records
Tax History Compared to Growth
Tax History
| Year | Tax Paid | Tax Assessment Tax Assessment Total Assessment is a certain percentage of the fair market value that is determined by local assessors to be the total taxable value of land and additions on the property. | Land | Improvement |
|---|---|---|---|---|
| 2025 | $9,003 | $893,200 | $375,000 | $518,200 |
| 2024 | $7,958 | $893,200 | $375,000 | $518,200 |
| 2023 | $7,387 | $893,200 | $375,000 | $518,200 |
| 2022 | $7,387 | $893,200 | $375,000 | $518,200 |
| 2021 | $7,949 | $893,200 | $375,000 | $518,200 |
| 2020 | $8,066 | $893,200 | $375,000 | $518,200 |
| 2019 | $7,771 | $893,200 | $375,000 | $518,200 |
| 2018 | $7,637 | $893,200 | $375,000 | $518,200 |
| 2017 | $7,905 | $893,200 | $375,000 | $518,200 |
| 2016 | $7,699 | $893,200 | $375,000 | $518,200 |
| 2015 | $7,422 | $893,200 | $375,000 | $518,200 |
| 2014 | $8,082 | $894,000 | $375,000 | $519,000 |
Source: Public Records
Map
Nearby Homes