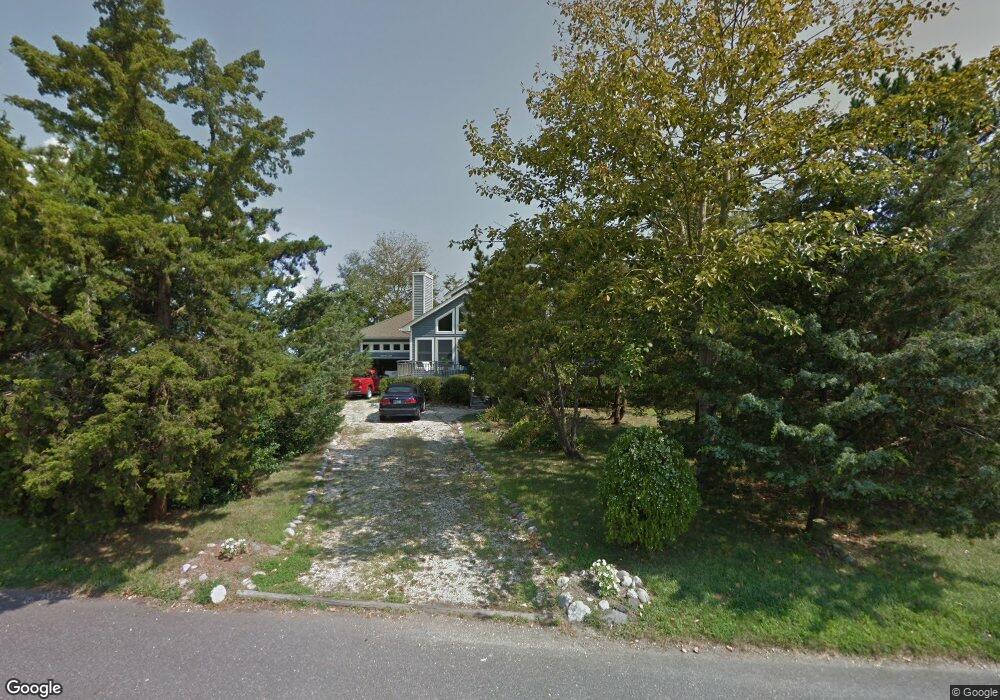
9 W 27th St Barnegat Light, NJ 08006
Long Beach Island NeighborhoodEstimated Value: $1,903,631 - $2,696,000
3
Beds
2
Baths
2,060
Sq Ft
$1,045/Sq Ft
Est. Value
About This Home
This home is located at 9 W 27th St, Barnegat Light, NJ 08006 and is currently estimated at $2,153,158, approximately $1,045 per square foot. 9 W 27th St is a home with nearby schools including Ethel A. Jacobsen Elementary School, Long Beach Island Grade School, and Southern Regional Middle School.
Ownership History
Date
Name
Owned For
Owner Type
Purchase Details
Closed on
Sep 10, 2025
Sold by
Nancy E Reinecker Revocable Trust and Desouza Leslie
Bought by
Desouza Leslie
Current Estimated Value
Purchase Details
Closed on
May 31, 2014
Sold by
Rienecker Nancy
Bought by
Reinecker Nancy E and Desouza Leslie
Purchase Details
Closed on
Dec 19, 2013
Sold by
Reinecker Nancy and Reinecker Erich Walter
Bought by
Reinecker Nancy
Create a Home Valuation Report for This Property
The Home Valuation Report is an in-depth analysis detailing your home's value as well as a comparison with similar homes in the area
Home Values in the Area
Average Home Value in this Area
Purchase History
| Date | Buyer | Sale Price | Title Company |
|---|---|---|---|
| Desouza Leslie | -- | None Listed On Document | |
| Desouza Leslie | -- | None Listed On Document | |
| Reinecker Nancy E | -- | None Available | |
| Reinecker Nancy | -- | None Available |
Source: Public Records
Tax History Compared to Growth
Tax History
| Year | Tax Paid | Tax Assessment Tax Assessment Total Assessment is a certain percentage of the fair market value that is determined by local assessors to be the total taxable value of land and additions on the property. | Land | Improvement |
|---|---|---|---|---|
| 2025 | $11,117 | $1,102,900 | $690,800 | $412,100 |
| 2024 | $9,827 | $1,102,900 | $690,800 | $412,100 |
| 2023 | $9,121 | $1,102,900 | $690,800 | $412,100 |
| 2022 | $9,121 | $1,102,900 | $690,800 | $412,100 |
| 2021 | $9,816 | $1,102,900 | $690,800 | $412,100 |
| 2020 | $9,959 | $1,102,900 | $690,800 | $412,100 |
| 2019 | $9,595 | $1,102,900 | $690,800 | $412,100 |
| 2018 | $9,430 | $1,102,900 | $690,800 | $412,100 |
| 2017 | $9,761 | $1,102,900 | $690,800 | $412,100 |
| 2016 | $9,507 | $1,102,900 | $690,800 | $412,100 |
| 2015 | $9,165 | $1,102,900 | $690,800 | $412,100 |
| 2014 | $9,974 | $1,103,300 | $690,800 | $412,500 |
Source: Public Records
Map
Nearby Homes