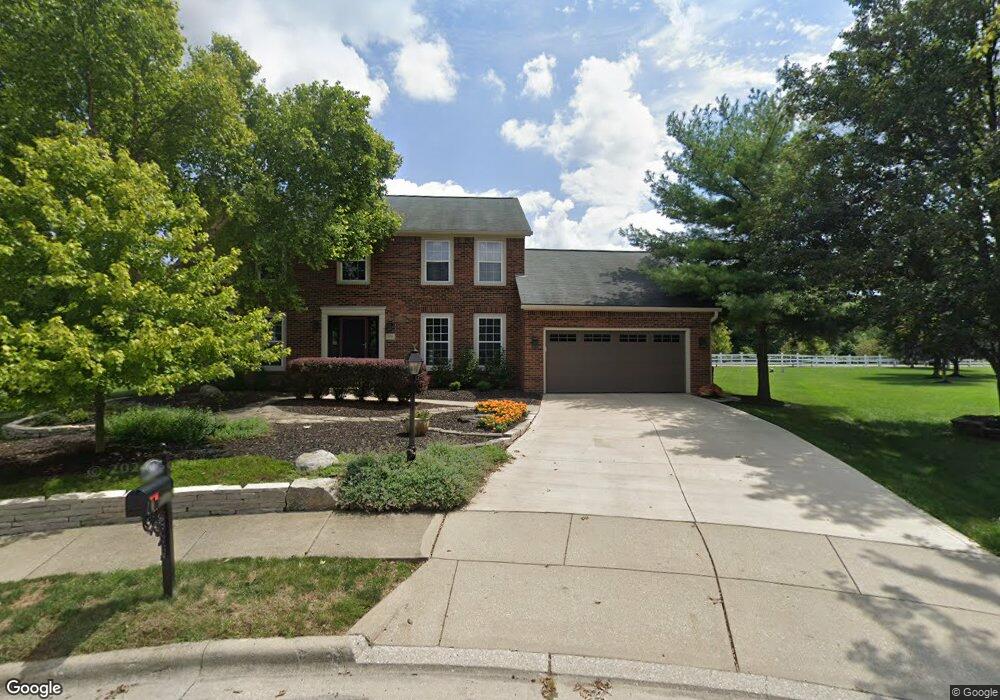
90 Gainsway Ct Powell, OH 43065
Liberty Township NeighborhoodEstimated Value: $579,590 - $604,000
4
Beds
3
Baths
2,798
Sq Ft
$211/Sq Ft
Est. Value
About This Home
This home is located at 90 Gainsway Ct, Powell, OH 43065 and is currently estimated at $590,648, approximately $211 per square foot. 90 Gainsway Ct is a home located in Delaware County with nearby schools including Tyler Run Elementary School, Olentangy Liberty Middle School, and Olentangy Liberty High School.
Ownership History
Date
Name
Owned For
Owner Type
Purchase Details
Closed on
May 26, 2023
Sold by
Furnas Andrew and Furnas Darlene J
Bought by
Treboni Burke W and Bulgrin Katherine M
Current Estimated Value
Home Financials for this Owner
Home Financials are based on the most recent Mortgage that was taken out on this home.
Original Mortgage
$536,750
Outstanding Balance
$522,397
Interest Rate
6.39%
Mortgage Type
New Conventional
Estimated Equity
$68,251
Purchase Details
Closed on
May 25, 2001
Sold by
Hollingshead Douglas E
Bought by
Furnas Andrew and Furnas Darlene J
Home Financials for this Owner
Home Financials are based on the most recent Mortgage that was taken out on this home.
Original Mortgage
$160,000
Interest Rate
7.07%
Mortgage Type
New Conventional
Purchase Details
Closed on
Dec 1, 1997
Sold by
Dominion Homes Inc
Bought by
Hollingshead Douglas E and Hollingshead Mary K
Home Financials for this Owner
Home Financials are based on the most recent Mortgage that was taken out on this home.
Original Mortgage
$195,950
Interest Rate
7.45%
Mortgage Type
New Conventional
Purchase Details
Closed on
Jul 30, 1997
Sold by
Pizzuti Equities Inc
Bought by
Borror Corp
Create a Home Valuation Report for This Property
The Home Valuation Report is an in-depth analysis detailing your home's value as well as a comparison with similar homes in the area
Home Values in the Area
Average Home Value in this Area
Purchase History
| Date | Buyer | Sale Price | Title Company |
|---|---|---|---|
| Treboni Burke W | $565,000 | Northwest Select Title | |
| Furnas Andrew | $231,000 | -- | |
| Hollingshead Douglas E | $217,725 | -- | |
| Borror Corp | $70,000 | -- |
Source: Public Records
Mortgage History
| Date | Status | Borrower | Loan Amount |
|---|---|---|---|
| Open | Treboni Burke W | $536,750 | |
| Previous Owner | Furnas Andrew | $160,000 | |
| Previous Owner | Hollingshead Douglas E | $195,950 |
Source: Public Records
Tax History Compared to Growth
Tax History
| Year | Tax Paid | Tax Assessment Tax Assessment Total Assessment is a certain percentage of the fair market value that is determined by local assessors to be the total taxable value of land and additions on the property. | Land | Improvement |
|---|---|---|---|---|
| 2024 | $8,685 | $165,760 | $35,840 | $129,920 |
| 2023 | $8,719 | $165,760 | $35,840 | $129,920 |
| 2022 | $8,095 | $122,020 | $26,290 | $95,730 |
| 2021 | $8,235 | $122,020 | $26,290 | $95,730 |
| 2020 | $8,264 | $122,020 | $26,290 | $95,730 |
| 2019 | $7,092 | $108,610 | $23,910 | $84,700 |
| 2018 | $7,174 | $108,610 | $23,910 | $84,700 |
| 2017 | $3,163 | $98,080 | $19,640 | $78,440 |
| 2016 | $6,951 | $98,080 | $19,640 | $78,440 |
| 2015 | $6,326 | $98,080 | $19,640 | $78,440 |
| 2014 | $6,410 | $98,080 | $19,640 | $78,440 |
| 2013 | $6,359 | $95,070 | $19,640 | $75,430 |
Source: Public Records
Map
Nearby Homes
- 1937 Liberty St
- 2020 Liberty St
- 120 S Liberty St
- 55 Timber Oak Ct
- 87 Murphys Oval Unit N87
- 274 Stamford Dr
- 6615 Scioto St
- 6583 Scioto St
- 6601 Scioto St
- 6555 Scioto St
- 11 Murphys View Place
- 255 Winter Hill Place
- 91 Tiller Dr
- 67 Traditions Way
- 261 Andover Dr
- Irving Plan at Encore Park of Powell - Uptown Collection
- Oakley Plan at Encore Park of Powell - Uptown Collection
- 110 Encore Park Bend
- 114 Encore Park Bend
- 92 Barrington Place
- 95 Gainsway Ct
- 96 Gainsway Ct
- 105 Gainsway Ct
- 94 Hartfield Ct
- 94 Hartfield Ct Unit 2027
- 106 Gainsway Ct
- 198 Donerail Ave
- 84 Hartfield Ct
- 104 Hartfield Ct
- 104 Hartfield Ct Unit 2028
- 115 Gainsway Ct
- 116 Gainsway Ct
- 114 Hartfield Ct
- 208 Donerail Ave
- 125 Gainsway Ct
- 124 Hartfield Ct
- 0 Business Opportunity Unit 66836
- 0 Business Opportunity Unit 2704511
- 0 Business Opportunity Unit 224019689
- 83 Hartfield Ct