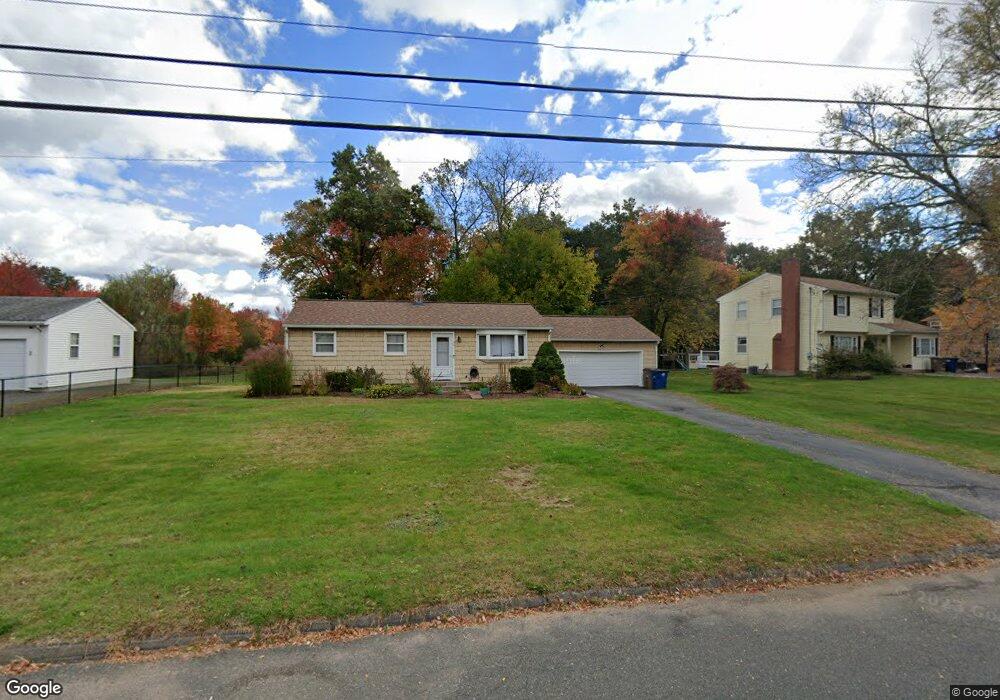
90 Gerald Dr Vernon Rockville, CT 06066
North Vernon NeighborhoodEstimated Value: $314,960 - $379,000
3
Beds
1
Bath
1,025
Sq Ft
$329/Sq Ft
Est. Value
About This Home
This home is located at 90 Gerald Dr, Vernon Rockville, CT 06066 and is currently estimated at $336,990, approximately $328 per square foot. 90 Gerald Dr is a home located in Tolland County with nearby schools including Skinner Road School, Vernon Center Middle School, and Rockville High School.
Ownership History
Date
Name
Owned For
Owner Type
Purchase Details
Closed on
Oct 7, 2019
Sold by
Valentine Colin
Bought by
Valentine Antoinette
Current Estimated Value
Home Financials for this Owner
Home Financials are based on the most recent Mortgage that was taken out on this home.
Original Mortgage
$134,000
Outstanding Balance
$86,784
Interest Rate
3%
Mortgage Type
New Conventional
Estimated Equity
$250,206
Purchase Details
Closed on
Oct 1, 2009
Sold by
Harmon Angela
Bought by
Valentine Antonette and Valentine Colin
Home Financials for this Owner
Home Financials are based on the most recent Mortgage that was taken out on this home.
Original Mortgage
$163,600
Interest Rate
5.12%
Mortgage Type
Purchase Money Mortgage
Purchase Details
Closed on
Nov 30, 1999
Sold by
Ello Frank and Ello Debra
Bought by
Harmon Angela
Purchase Details
Closed on
Jul 25, 1994
Sold by
Sklar Mark
Bought by
Ello Frank and Merritt Debra
Create a Home Valuation Report for This Property
The Home Valuation Report is an in-depth analysis detailing your home's value as well as a comparison with similar homes in the area
Home Values in the Area
Average Home Value in this Area
Purchase History
| Date | Buyer | Sale Price | Title Company |
|---|---|---|---|
| Valentine Antoinette | -- | -- | |
| Valentine Antonette | $204,500 | -- | |
| Harmon Angela | $132,600 | -- | |
| Ello Frank | $124,000 | -- |
Source: Public Records
Mortgage History
| Date | Status | Borrower | Loan Amount |
|---|---|---|---|
| Open | Ello Frank | $134,000 | |
| Previous Owner | Ello Frank | $163,600 | |
| Previous Owner | Ello Frank | $110,852 | |
| Previous Owner | Ello Frank | $103,672 |
Source: Public Records
Tax History Compared to Growth
Tax History
| Year | Tax Paid | Tax Assessment Tax Assessment Total Assessment is a certain percentage of the fair market value that is determined by local assessors to be the total taxable value of land and additions on the property. | Land | Improvement |
|---|---|---|---|---|
| 2025 | $4,784 | $132,570 | $40,670 | $91,900 |
| 2024 | $4,652 | $132,570 | $40,670 | $91,900 |
| 2023 | $4,427 | $132,570 | $40,670 | $91,900 |
| 2022 | $4,427 | $132,570 | $40,670 | $91,900 |
| 2021 | $4,444 | $112,140 | $39,620 | $72,520 |
| 2020 | $4,444 | $112,140 | $39,620 | $72,520 |
| 2019 | $4,444 | $112,140 | $39,620 | $72,520 |
| 2018 | $4,444 | $112,140 | $39,620 | $72,520 |
| 2017 | $4,341 | $112,140 | $39,620 | $72,520 |
| 2016 | $4,622 | $121,530 | $50,890 | $70,640 |
| 2015 | $4,486 | $121,530 | $50,890 | $70,640 |
| 2014 | $4,388 | $121,530 | $50,890 | $70,640 |
Source: Public Records
Map
Nearby Homes
- 14 Pinney St Unit 24
- 1 Abbott Rd Unit 85
- 1 Abbott Rd Unit 101
- 18 Hayes Ave
- 0 Abbott Rd
- 45 Windermere Village Rd Unit 45
- 60 Old Town Rd Unit 143
- 60 Old Town Rd Unit 29
- 60 Old Town Rd Unit 67
- 155 New Marker Rd
- 565 Talcottville Rd Unit 1C4
- 4 Loveland Hill Rd Unit C4
- 721 Dart Hill Rd
- 3 Standish Rd
- 201 Regan Rd Unit 2B
- 80 Country Ln Unit 40
- 80 Country Ln Unit 11
- 16 Ellridge Place
- 4 Bellevue Ave
- 113 Regan Rd