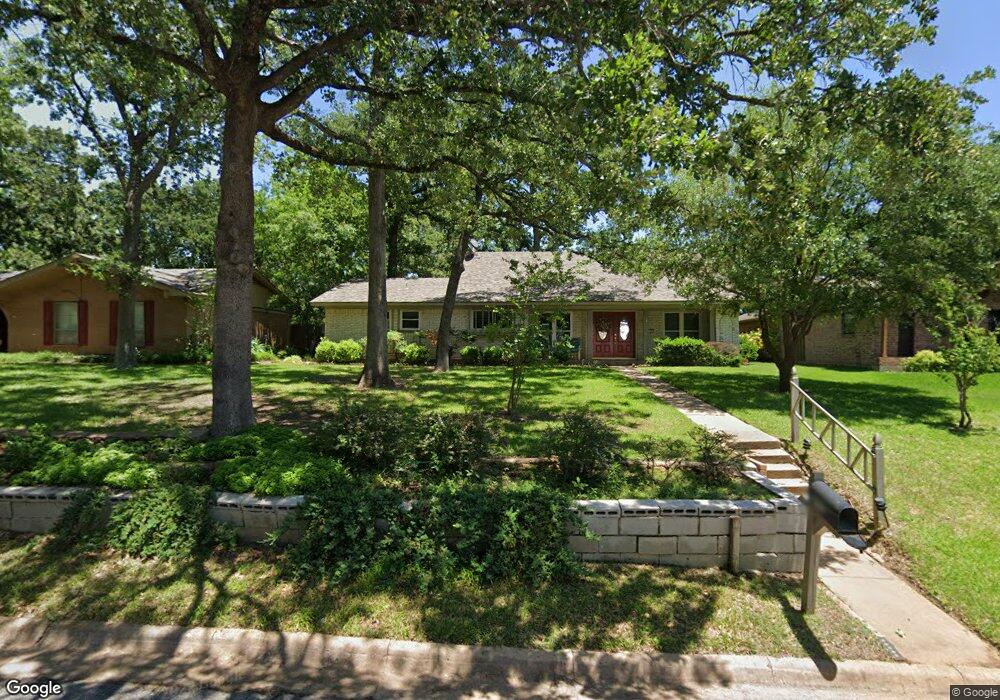
900 Glen Key St Denison, TX 75020
Estimated Value: $238,142 - $365,000
3
Beds
2
Baths
2,061
Sq Ft
$146/Sq Ft
Est. Value
About This Home
This home is located at 900 Glen Key St, Denison, TX 75020 and is currently estimated at $301,571, approximately $146 per square foot. 900 Glen Key St is a home located in Grayson County with nearby schools including Mayes Elementary School, Scott Middle School, and Denison High School.
Ownership History
Date
Name
Owned For
Owner Type
Purchase Details
Closed on
Feb 14, 2019
Sold by
Donohoe Donohoe Naomi Naomi and Donohoe Marlin
Bought by
Milner Ben and Milner Sherryl
Current Estimated Value
Home Financials for this Owner
Home Financials are based on the most recent Mortgage that was taken out on this home.
Original Mortgage
$152,192
Outstanding Balance
$133,804
Interest Rate
4.5%
Mortgage Type
FHA
Estimated Equity
$167,767
Purchase Details
Closed on
Oct 7, 2005
Sold by
Hottle Christopher W and Hottle Lorae
Bought by
Donohoe Marlin and Donohoe Naomi
Home Financials for this Owner
Home Financials are based on the most recent Mortgage that was taken out on this home.
Original Mortgage
$10,400
Interest Rate
6.75%
Mortgage Type
Stand Alone Second
Create a Home Valuation Report for This Property
The Home Valuation Report is an in-depth analysis detailing your home's value as well as a comparison with similar homes in the area
Home Values in the Area
Average Home Value in this Area
Purchase History
| Date | Buyer | Sale Price | Title Company |
|---|---|---|---|
| Milner Ben | -- | None Available | |
| Donohoe Marlin | -- | -- |
Source: Public Records
Mortgage History
| Date | Status | Borrower | Loan Amount |
|---|---|---|---|
| Open | Milner Ben | $152,192 | |
| Previous Owner | Donohoe Marlin | $10,400 | |
| Previous Owner | Donohoe Marlin | $83,200 |
Source: Public Records
Tax History Compared to Growth
Tax History
| Year | Tax Paid | Tax Assessment Tax Assessment Total Assessment is a certain percentage of the fair market value that is determined by local assessors to be the total taxable value of land and additions on the property. | Land | Improvement |
|---|---|---|---|---|
| 2025 | $1,873 | $221,337 | $53,712 | $167,625 |
| 2024 | $4,786 | $205,990 | $0 | $0 |
| 2023 | $1,874 | $187,264 | $0 | $0 |
| 2022 | $4,045 | $170,240 | $0 | $0 |
| 2021 | $3,903 | $154,764 | $31,523 | $123,241 |
| 2020 | $4,070 | $154,313 | $17,611 | $136,702 |
| 2019 | $4,083 | $148,393 | $17,611 | $130,782 |
| 2018 | $4,083 | $174,727 | $14,617 | $160,110 |
| 2017 | $3,747 | $158,018 | $12,856 | $145,162 |
| 2016 | $3,408 | $147,274 | $12,592 | $134,682 |
| 2015 | $1,586 | $111,983 | $8,365 | $103,618 |
| 2014 | $1,736 | $111,983 | $8,365 | $103,618 |
Source: Public Records
Map
Nearby Homes
- 800 Glen Key St
- 813 Glen Key St
- 44 Haven Cir
- 922 S Hyde Park Ave
- 22 Haven Cir
- 16 Haven Cir
- 12 Village Green Ct
- 631 Kerby Dr
- 1800 W Crawford St
- 2603 Brookhaven Dr
- 2521 Brookhaven Dr
- 2914 Village Cir
- TBD 3 S Lillis Ln
- TBD 2 S Lillis Ln
- 901 Waterloo Lake Dr
- 931 Waterloo Lake Dr
- 14 Lillis Park Cir
- 2396 Miller St
- 2380 Miller St
- 2389 Miller St
- 906 Glen Key St
- 830 Glen Key St
- 822 Glen Key St
- 901 S Hyde Park Ave
- 914 Glen Key St
- 907 S Hyde Park Ave
- 831 S Hyde Park Ave
- 901 Glen Key St
- 907 Glen Key St
- 825 Glen Key St
- 819 S Hyde Park Ave
- 913 S Hyde Park Ave
- 814 Glen Key St
- 913 Glen Key St
- 819 Glen Key St
- 813 S Hyde Park Ave
- 806 Glen Key St
- 919 Glen Key St
- 813 Glen Key St
- 830 S Hyde Park Ave