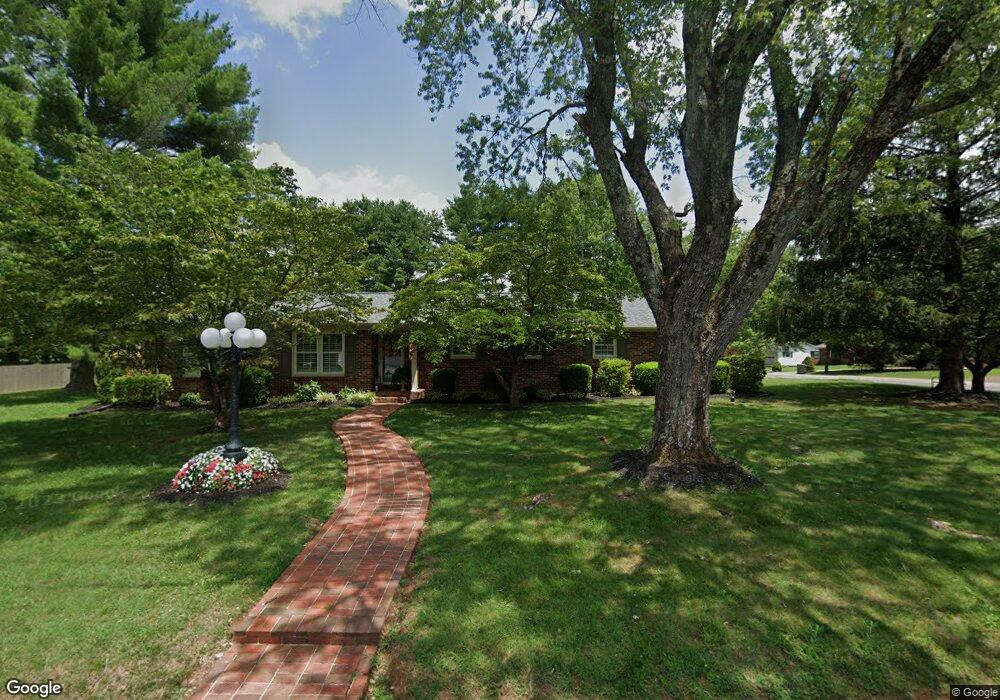
900 Springer Rd Lawrenceburg, TN 38464
Estimated Value: $283,472 - $365,000
--
Bed
2
Baths
2,234
Sq Ft
$144/Sq Ft
Est. Value
About This Home
This home is located at 900 Springer Rd, Lawrenceburg, TN 38464 and is currently estimated at $320,618, approximately $143 per square foot. 900 Springer Rd is a home located in Lawrence County with nearby schools including Ingram Sowell Elementary School, Lawrenceburg Public Elementary School, and David Crockett Elementary School.
Ownership History
Date
Name
Owned For
Owner Type
Purchase Details
Closed on
Oct 16, 2024
Sold by
Giles Mary Catherine and Bailey Mary Catherine
Bought by
Bailey Mary Catherine
Current Estimated Value
Purchase Details
Closed on
Sep 8, 2016
Sold by
Giles Morris
Bought by
Giles Mary Catherine
Home Financials for this Owner
Home Financials are based on the most recent Mortgage that was taken out on this home.
Original Mortgage
$136,898
Interest Rate
3.44%
Mortgage Type
New Conventional
Purchase Details
Closed on
Jan 28, 2008
Sold by
Mclean Jeffrey H
Bought by
Morris Giles
Home Financials for this Owner
Home Financials are based on the most recent Mortgage that was taken out on this home.
Original Mortgage
$126,400
Interest Rate
6.22%
Purchase Details
Closed on
Jan 6, 1989
Bought by
Morris Robert L and Morris Carolyn
Purchase Details
Closed on
Feb 15, 1978
Bought by
Mcanally Harold and Mcanally Linda
Create a Home Valuation Report for This Property
The Home Valuation Report is an in-depth analysis detailing your home's value as well as a comparison with similar homes in the area
Home Values in the Area
Average Home Value in this Area
Purchase History
| Date | Buyer | Sale Price | Title Company |
|---|---|---|---|
| Bailey Mary Catherine | -- | None Listed On Document | |
| Giles Mary Catherine | -- | -- | |
| Giles Mary Catherine | -- | -- | |
| Morris Giles | $158,000 | -- | |
| Morris Robert L | $95,800 | -- | |
| Mcanally Harold | -- | -- |
Source: Public Records
Mortgage History
| Date | Status | Borrower | Loan Amount |
|---|---|---|---|
| Previous Owner | Giles Mary Catherine | $136,898 | |
| Previous Owner | Mcanally Harold | $126,400 |
Source: Public Records
Tax History Compared to Growth
Tax History
| Year | Tax Paid | Tax Assessment Tax Assessment Total Assessment is a certain percentage of the fair market value that is determined by local assessors to be the total taxable value of land and additions on the property. | Land | Improvement |
|---|---|---|---|---|
| 2025 | $1,755 | $56,475 | $0 | $0 |
| 2024 | $1,755 | $56,475 | $5,625 | $50,850 |
| 2023 | $1,755 | $56,475 | $5,625 | $50,850 |
| 2022 | $1,755 | $56,475 | $5,625 | $50,850 |
| 2021 | $1,544 | $35,125 | $4,375 | $30,750 |
| 2020 | $1,544 | $35,125 | $4,375 | $30,750 |
| 2019 | $1,544 | $35,125 | $4,375 | $30,750 |
| 2018 | $1,544 | $35,125 | $4,375 | $30,750 |
| 2017 | $1,544 | $35,125 | $4,375 | $30,750 |
| 2016 | $1,544 | $35,125 | $4,375 | $30,750 |
| 2015 | $1,462 | $35,125 | $4,375 | $30,750 |
| 2014 | $1,438 | $34,550 | $4,375 | $30,175 |
Source: Public Records
Map
Nearby Homes