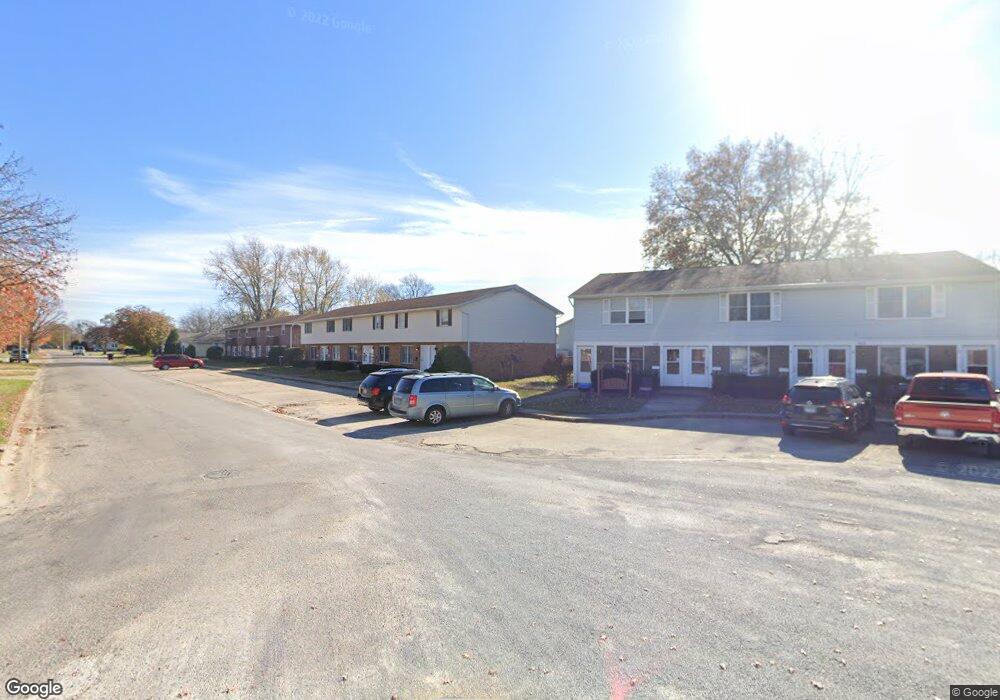
900 W Street Louis Ave Effingham, IL 62401
Estimated Value: $145,000 - $263,000
3
Beds
1
Bath
2,640
Sq Ft
$69/Sq Ft
Est. Value
About This Home
This home is located at 900 W Street Louis Ave, Effingham, IL 62401 and is currently estimated at $183,109, approximately $69 per square foot. 900 W Street Louis Ave is a home located in Effingham County with nearby schools including South Side Grade School, Early Learning Center, and Central Grade School.
Ownership History
Date
Name
Owned For
Owner Type
Purchase Details
Closed on
Feb 8, 2021
Sold by
Ruiz Adam R
Bought by
Ortiz Antonio Lopez and Ortiz Raquel Lopez
Current Estimated Value
Purchase Details
Closed on
Jun 9, 2009
Sold by
Zumbahlen James D
Bought by
Ruiz Adam R
Home Financials for this Owner
Home Financials are based on the most recent Mortgage that was taken out on this home.
Original Mortgage
$74,400
Interest Rate
5%
Mortgage Type
Unknown
Purchase Details
Closed on
Oct 17, 2008
Sold by
Williams Rebecca J and Groth Fred
Bought by
Zumbahlen James D
Home Financials for this Owner
Home Financials are based on the most recent Mortgage that was taken out on this home.
Original Mortgage
$60,750
Interest Rate
6.2%
Mortgage Type
Unknown
Purchase Details
Closed on
Sep 19, 2005
Sold by
Miller Geneva
Bought by
Williams Rebecca J
Create a Home Valuation Report for This Property
The Home Valuation Report is an in-depth analysis detailing your home's value as well as a comparison with similar homes in the area
Home Values in the Area
Average Home Value in this Area
Purchase History
| Date | Buyer | Sale Price | Title Company |
|---|---|---|---|
| Ortiz Antonio Lopez | $95,000 | Attorney | |
| Ruiz Adam R | -- | None Available | |
| Zumbahlen James D | $66,000 | None Available | |
| Williams Rebecca J | -- | None Available |
Source: Public Records
Mortgage History
| Date | Status | Borrower | Loan Amount |
|---|---|---|---|
| Previous Owner | Ruiz Adam R | $74,400 | |
| Previous Owner | Zumbahlen James D | $60,750 |
Source: Public Records
Tax History Compared to Growth
Tax History
| Year | Tax Paid | Tax Assessment Tax Assessment Total Assessment is a certain percentage of the fair market value that is determined by local assessors to be the total taxable value of land and additions on the property. | Land | Improvement |
|---|---|---|---|---|
| 2024 | $1,417 | $38,330 | $12,460 | $25,870 |
| 2023 | $1,428 | $34,850 | $11,330 | $23,520 |
| 2022 | $1,473 | $31,970 | $10,390 | $21,580 |
| 2021 | $1,992 | $31,660 | $10,290 | $21,370 |
| 2020 | $3,027 | $41,310 | $10,000 | $31,310 |
| 2019 | $2,970 | $40,900 | $9,900 | $31,000 |
| 2018 | $2,874 | $39,330 | $9,520 | $29,810 |
| 2017 | $2,594 | $35,410 | $6,180 | $29,230 |
| 2016 | $2,097 | $34,380 | $6,000 | $28,380 |
| 2015 | -- | $33,380 | $5,830 | $27,550 |
| 2014 | -- | $32,410 | $5,660 | $26,750 |
| 2013 | -- | $31,780 | $5,550 | $26,230 |
| 2012 | -- | $31,310 | $5,470 | $25,840 |
Source: Public Records
Map
Nearby Homes
- 702 W Fayette Ave
- 406 W Kentucky Ave
- 0 Augusta National Dr Unit 6255461
- 0 S Lakewood Dr
- 710 W Richland Ave
- 407 W Edgar Ave
- 601 S Maple St
- 1006 N Koester Dr
- 1600 W Fayette Ave
- 100 E Temple Ave
- 505 W Evergreen Ave
- 1105 N Merchant St
- 602 S 5th St
- 1201 N Martin St
- 104 S Willow St
- 603 E Saint Louis Ave
- 801 N Cleveland St
- 812 S 4th St
- 1005 S 3rd St
- 805 N Glenwood St
- 900 W Saint Louis Ave
- 902 W Saint Louis Ave
- 902 W Street Louis Ave
- 904 W Saint Louis Ave
- 309 N Cherry St
- 910 W Saint Louis Ave
- 910 W Street Louis Ave
- 402 N Oak St
- 906 W Saint Louis Ave
- 906 W Street Louis Ave
- 903 W Saint Louis Ave
- 308 N Cherry St
- 905 W Saint Louis Ave
- 307 N Cherry St
- 907 W Street Louis Ave
- 0 907st Louis
- 907 W Saint Louis Ave
- 306B N Cherry St
- 306 N Cherry St
- 306A N Cherry St