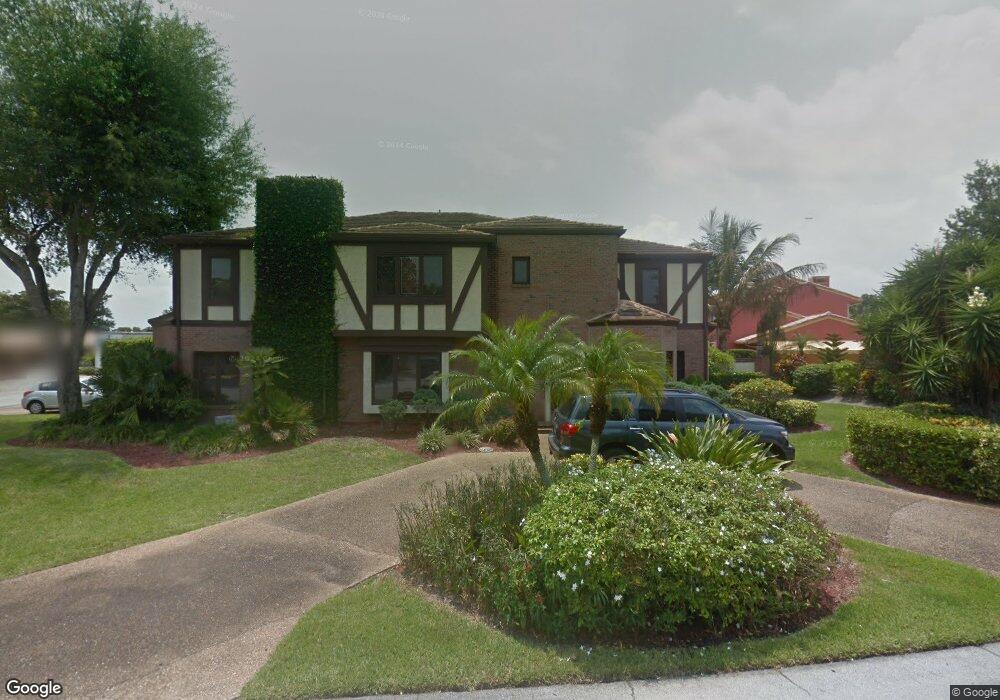
9000 N Lake Dasha Dr Plantation, FL 33324
Estimated Value: $1,044,552 - $1,251,000
--
Bed
--
Bath
4,404
Sq Ft
$262/Sq Ft
Est. Value
About This Home
This home is located at 9000 N Lake Dasha Dr, Plantation, FL 33324 and is currently estimated at $1,152,388, approximately $261 per square foot. 9000 N Lake Dasha Dr is a home located in Broward County with nearby schools including Tropical Elementary School, Seminole Middle School, and South Plantation High School.
Ownership History
Date
Name
Owned For
Owner Type
Purchase Details
Closed on
Sep 12, 2006
Sold by
Prudential Relocation Inc
Bought by
Gilbert Charles and Gilbert Josephine N
Current Estimated Value
Home Financials for this Owner
Home Financials are based on the most recent Mortgage that was taken out on this home.
Original Mortgage
$624,000
Outstanding Balance
$370,842
Interest Rate
6.48%
Mortgage Type
Stand Alone First
Estimated Equity
$781,546
Purchase Details
Closed on
May 22, 2006
Sold by
Milani David and Milani Wendy A
Bought by
Prudential Relocation Inc
Purchase Details
Closed on
Sep 28, 2001
Sold by
Lane Ronald J and Lane Veronica A
Bought by
Milani David and Milani Wendy A
Home Financials for this Owner
Home Financials are based on the most recent Mortgage that was taken out on this home.
Original Mortgage
$328,000
Interest Rate
6.37%
Purchase Details
Closed on
Jun 1, 1988
Sold by
Available Not
Bought by
Available Not
Create a Home Valuation Report for This Property
The Home Valuation Report is an in-depth analysis detailing your home's value as well as a comparison with similar homes in the area
Home Values in the Area
Average Home Value in this Area
Purchase History
| Date | Buyer | Sale Price | Title Company |
|---|---|---|---|
| Gilbert Charles | $780,000 | Attorney | |
| Prudential Relocation Inc | $850,000 | Attorney | |
| Milani David | $410,000 | -- | |
| Available Not | $353,571 | -- |
Source: Public Records
Mortgage History
| Date | Status | Borrower | Loan Amount |
|---|---|---|---|
| Open | Gilbert Charles | $624,000 | |
| Previous Owner | Milani David | $328,000 | |
| Closed | Milani David | $42,266 |
Source: Public Records
Tax History Compared to Growth
Tax History
| Year | Tax Paid | Tax Assessment Tax Assessment Total Assessment is a certain percentage of the fair market value that is determined by local assessors to be the total taxable value of land and additions on the property. | Land | Improvement |
|---|---|---|---|---|
| 2025 | $9,149 | $501,990 | -- | -- |
| 2024 | $8,964 | $487,850 | -- | -- |
| 2023 | $8,964 | $473,650 | $0 | $0 |
| 2022 | $8,566 | $459,860 | $0 | $0 |
| 2021 | $8,319 | $446,470 | $0 | $0 |
| 2020 | $8,179 | $440,310 | $0 | $0 |
| 2019 | $8,039 | $430,420 | $0 | $0 |
| 2018 | $7,771 | $422,400 | $0 | $0 |
| 2017 | $7,701 | $413,720 | $0 | $0 |
| 2016 | $7,588 | $405,220 | $0 | $0 |
| 2015 | $7,729 | $402,410 | $0 | $0 |
| 2014 | $7,734 | $399,220 | $0 | $0 |
| 2013 | -- | $523,180 | $64,590 | $458,590 |
Source: Public Records
Map
Nearby Homes
- 200 Jacaranda Country Club Dr Unit 3-C
- 281 Jacaranda Dr Unit 13
- 250 Jacaranda Dr Unit 402
- 250 Jacaranda Dr Unit 305
- 250 Jacaranda Dr Unit 206
- 295 Jacaranda Dr Unit 20
- 120 Jacaranda Country Club Dr Unit 202
- 150 Jacaranda Country Club Dr Unit 200
- 17 Jacaranda Dr Unit 117
- 206 Wimbledon Lake Dr Unit 22190
- 225 Wimbledon Lake Dr Unit 225
- 241 Wimbledon Lake Dr Unit 213
- 110 Jacaranda Country Club Dr Unit 205
- 110 Jacaranda Country Club Dr Unit 104
- 247 Wimbledon Lake Dr Unit 38757
- 1 Jacaranda Country Club Dr Unit 104
- 8811 Gatehouse Rd Unit 8
- 610 Lake Dasha Cir
- 52 Wimbledon Lake Dr Unit 200
- 26 Wimbledon Lakes Dr Unit 248
- 9020 N Lake Dasha Dr
- 8980 Mahogany Way
- 9001 N Lake Dasha Dr
- 8960 N Lake Dasha Dr
- 8981 N Lake Dasha Dr
- 410 W Lake Dasha Dr
- 9021 N Lake Dasha Dr
- 8970 Mahogany Way
- 9041 N Lake Dasha Dr
- 8961 N Lake Dasha Dr
- 420 W Lake Dasha Dr
- 391 W Lake Dasha Dr
- 351 Mahogany Terrace
- 8908 Mahogany Terrace
- 8941 N Lake Dasha Dr
- 411 W Lake Dasha Dr
- 921 Jacaranda Ct
- 430 W Lake Dasha Dr
- 421 W Lake Dasha Dr
- 8921 N Lake Dasha Dr