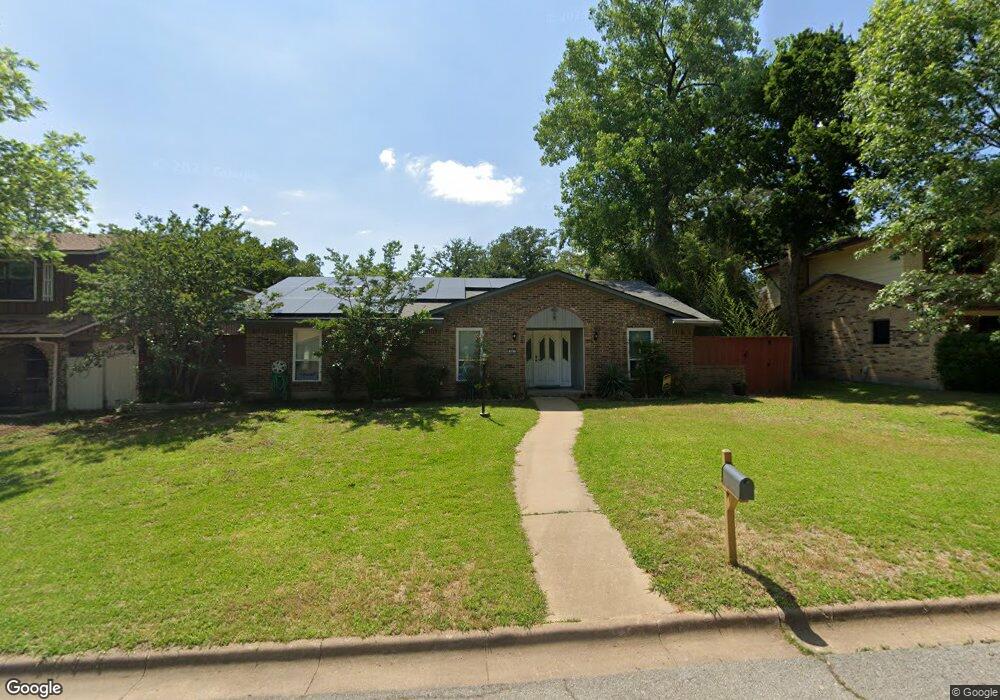
901 S Hyde Park Ave Denison, TX 75020
Estimated Value: $256,381 - $278,000
3
Beds
2
Baths
2,055
Sq Ft
$130/Sq Ft
Est. Value
About This Home
This home is located at 901 S Hyde Park Ave, Denison, TX 75020 and is currently estimated at $267,191, approximately $130 per square foot. 901 S Hyde Park Ave is a home located in Grayson County with nearby schools including Mayes Elementary School, Scott Middle School, and Denison High School.
Ownership History
Date
Name
Owned For
Owner Type
Purchase Details
Closed on
Jun 15, 2022
Sold by
Maria Ortiz
Bought by
Ortiz Eustolio
Current Estimated Value
Purchase Details
Closed on
Dec 5, 2012
Sold by
Mckelvey Mary and Mckelvey Mary Baty
Bought by
Ortiz Eustolio and Ortiz Maria
Home Financials for this Owner
Home Financials are based on the most recent Mortgage that was taken out on this home.
Original Mortgage
$61,000
Interest Rate
3.42%
Mortgage Type
New Conventional
Purchase Details
Closed on
Mar 21, 2011
Sold by
Frances Myers Collins Revocable Trust
Bought by
Ortiz Eustolio
Home Financials for this Owner
Home Financials are based on the most recent Mortgage that was taken out on this home.
Original Mortgage
$65,072
Interest Rate
5.06%
Mortgage Type
New Conventional
Purchase Details
Closed on
May 5, 2010
Sold by
Collins Frances M
Bought by
Frances Myers Collins Revocable Trust
Create a Home Valuation Report for This Property
The Home Valuation Report is an in-depth analysis detailing your home's value as well as a comparison with similar homes in the area
Home Values in the Area
Average Home Value in this Area
Purchase History
| Date | Buyer | Sale Price | Title Company |
|---|---|---|---|
| Ortiz Eustolio | -- | None Listed On Document | |
| Ortiz Eustolio | -- | Grayson County Title | |
| Ortiz Eustolio | -- | Grayson County Title | |
| Frances Myers Collins Revocable Trust | -- | None Available |
Source: Public Records
Mortgage History
| Date | Status | Borrower | Loan Amount |
|---|---|---|---|
| Previous Owner | Ortiz Eustolio | $61,000 | |
| Previous Owner | Ortiz Eustolio | $65,072 |
Source: Public Records
Tax History Compared to Growth
Tax History
| Year | Tax Paid | Tax Assessment Tax Assessment Total Assessment is a certain percentage of the fair market value that is determined by local assessors to be the total taxable value of land and additions on the property. | Land | Improvement |
|---|---|---|---|---|
| 2025 | $3,915 | $226,113 | $52,920 | $173,193 |
| 2024 | $5,212 | $224,351 | $44,604 | $179,747 |
| 2023 | $3,166 | $244,252 | $0 | $0 |
| 2022 | $4,283 | $180,263 | $0 | $0 |
| 2021 | $4,133 | $166,261 | $31,164 | $135,097 |
| 2020 | $3,930 | $167,992 | $16,968 | $151,024 |
| 2019 | $3,727 | $162,887 | $16,968 | $145,919 |
| 2018 | $3,416 | $148,365 | $14,112 | $134,253 |
| 2017 | $3,131 | $111,929 | $12,264 | $99,665 |
| 2016 | $2,932 | $106,783 | $12,180 | $94,603 |
| 2015 | $2,692 | $95,292 | $8,064 | $87,228 |
| 2014 | $2,693 | $95,320 | $8,064 | $87,256 |
Source: Public Records
Map
Nearby Homes
- 813 Glen Key St
- 800 Glen Key St
- 922 S Hyde Park Ave
- 44 Haven Cir
- 22 Haven Cir
- 16 Haven Cir
- 12 Village Green Ct
- 631 Kerby Dr
- 1800 W Crawford St
- 2603 Brookhaven Dr
- 2914 Village Cir
- TBD 3 S Lillis Ln
- TBD 2 S Lillis Ln
- 2521 Brookhaven Dr
- 14 Lillis Park Cir
- 901 Waterloo Lake Dr
- 931 Waterloo Lake Dr
- 131 S Imperial Dr
- 2396 Miller St
- 2380 Miller St
- 907 S Hyde Park Ave
- 831 S Hyde Park Ave
- 819 S Hyde Park Ave
- 900 Glen Key St
- 913 S Hyde Park Ave
- 906 Glen Key St
- 830 S Hyde Park Ave
- 830 Glen Key St
- 822 S Hyde Park Ave
- 906 S Hyde Park Ave
- 914 Glen Key St
- 822 Glen Key St
- 813 S Hyde Park Ave
- 814 S Hyde Park Ave
- 914 S Hyde Park Ave
- 814 Glen Key St
- 806 S Hyde Park Ave
- 807 S Hyde Park Ave
- 38 Haven Cir
- 40 Haven Cir