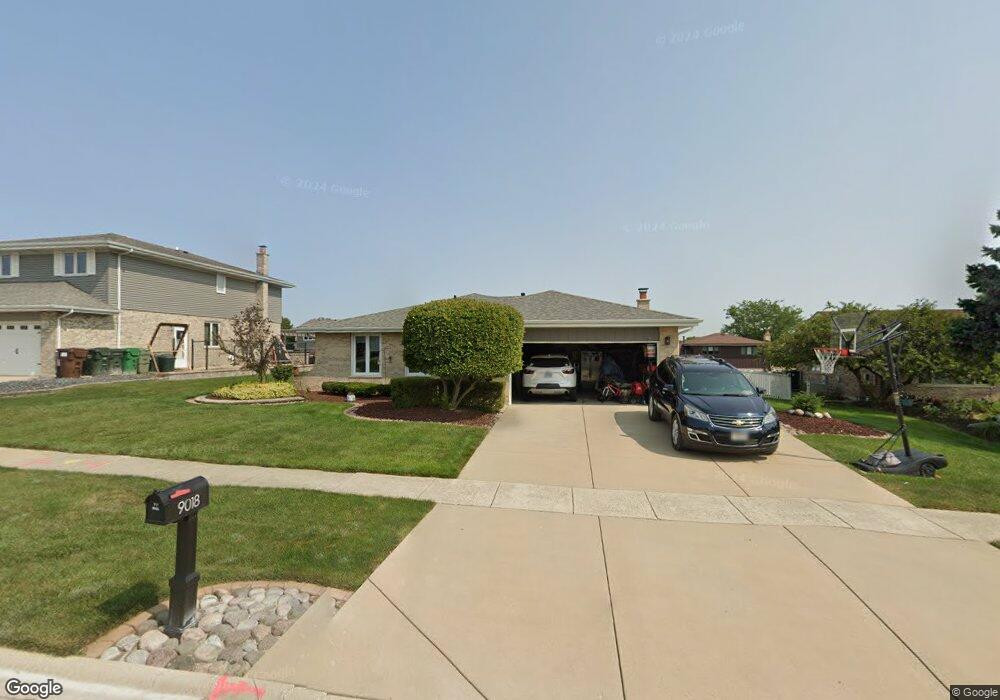
9018 Poplar St Tinley Park, IL 60487
Central Tinley Park NeighborhoodEstimated Value: $398,396 - $440,000
3
Beds
3
Baths
1,828
Sq Ft
$231/Sq Ft
Est. Value
About This Home
This home is located at 9018 Poplar St, Tinley Park, IL 60487 and is currently estimated at $422,599, approximately $231 per square foot. 9018 Poplar St is a home located in Cook County with nearby schools including Christa Mcauliffe School, Prairie View Middle School, and Victor J Andrew High School.
Ownership History
Date
Name
Owned For
Owner Type
Purchase Details
Closed on
Jul 26, 2007
Sold by
Stolinski Robert and Stolinski Kathleen
Bought by
Odonnell Kristin M
Current Estimated Value
Home Financials for this Owner
Home Financials are based on the most recent Mortgage that was taken out on this home.
Original Mortgage
$260,000
Outstanding Balance
$165,458
Interest Rate
6.76%
Mortgage Type
Unknown
Estimated Equity
$257,141
Create a Home Valuation Report for This Property
The Home Valuation Report is an in-depth analysis detailing your home's value as well as a comparison with similar homes in the area
Home Values in the Area
Average Home Value in this Area
Purchase History
| Date | Buyer | Sale Price | Title Company |
|---|---|---|---|
| Odonnell Kristin M | $330,000 | Chicago Title Insurance Co |
Source: Public Records
Mortgage History
| Date | Status | Borrower | Loan Amount |
|---|---|---|---|
| Open | Odonnell Kristin M | $260,000 |
Source: Public Records
Tax History Compared to Growth
Tax History
| Year | Tax Paid | Tax Assessment Tax Assessment Total Assessment is a certain percentage of the fair market value that is determined by local assessors to be the total taxable value of land and additions on the property. | Land | Improvement |
|---|---|---|---|---|
| 2024 | $8,089 | $32,449 | $5,760 | $26,689 |
| 2023 | $6,990 | $34,000 | $5,760 | $28,240 |
| 2022 | $6,990 | $23,029 | $5,040 | $17,989 |
| 2021 | $6,796 | $23,028 | $5,040 | $17,988 |
| 2020 | $6,696 | $23,028 | $5,040 | $17,988 |
| 2019 | $7,303 | $25,948 | $4,560 | $21,388 |
| 2018 | $7,145 | $25,948 | $4,560 | $21,388 |
| 2017 | $6,973 | $25,948 | $4,560 | $21,388 |
| 2016 | $5,917 | $20,313 | $4,080 | $16,233 |
| 2015 | $5,812 | $20,313 | $4,080 | $16,233 |
| 2014 | $6,312 | $21,946 | $4,080 | $17,866 |
| 2013 | $6,649 | $24,645 | $4,080 | $20,565 |
Source: Public Records
Map
Nearby Homes
- 17533 Pecan Ln
- 17964 Upland Dr
- 9280 Windsor Pkwy Unit 92
- 9260 Windsor Pkwy Unit 80
- 9201 175th St
- 18055 Upland Dr
- 17631 Dover Ct
- Fremont Plan at Radcliffe Place
- Calysta Plan at Radcliffe Place
- Danbury Plan at Radcliffe Place
- Briarcliffe Plan at Radcliffe Place
- Eden Plan at Radcliffe Place
- Amberwood Plan at Radcliffe Place
- 9038 Mansfield Dr Unit 8
- 9051 Mansfield Dr Unit 1
- 18248 Murphy Cir Unit 182
- 17535 S La Grange Rd
- 17535-2 Lagrange Rd
- 17230 Shetland Dr
- 17324 Humber Ln