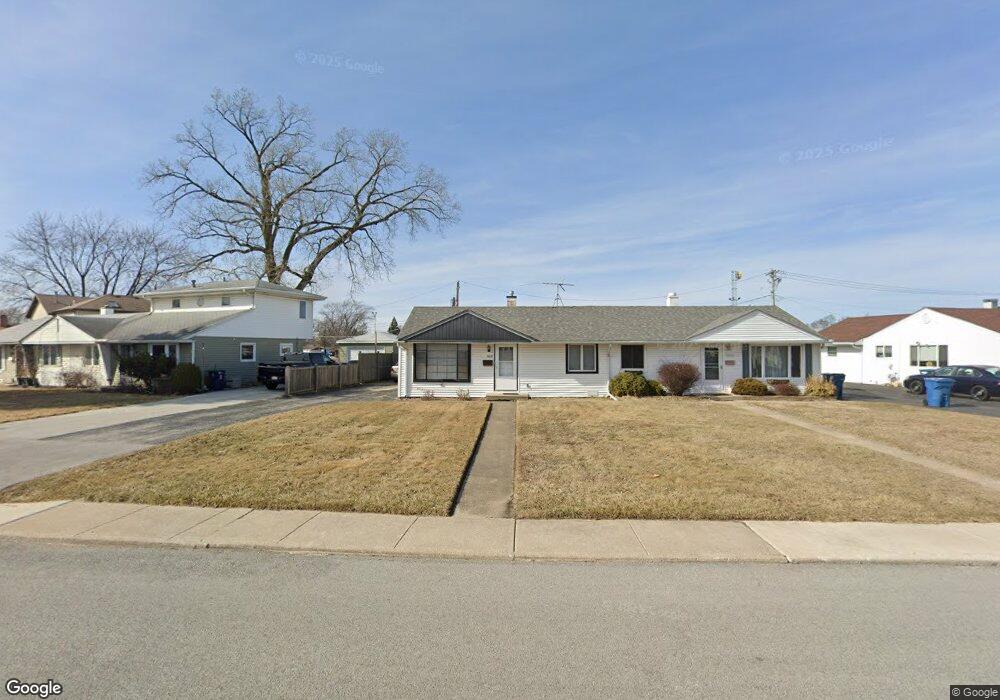
9018 S Beck Place Hometown, IL 60456
Estimated Value: $188,000 - $220,000
2
Beds
1
Bath
744
Sq Ft
$276/Sq Ft
Est. Value
About This Home
This home is located at 9018 S Beck Place, Hometown, IL 60456 and is currently estimated at $205,598, approximately $276 per square foot. 9018 S Beck Place is a home located in Cook County with nearby schools including Hometown Elementary School, J Covington Elementary School, and Sward Elementary School.
Ownership History
Date
Name
Owned For
Owner Type
Purchase Details
Closed on
Sep 8, 2005
Sold by
Friel Dolores M
Bought by
Moline Dawn M
Current Estimated Value
Home Financials for this Owner
Home Financials are based on the most recent Mortgage that was taken out on this home.
Original Mortgage
$70,000
Outstanding Balance
$37,826
Interest Rate
6.01%
Mortgage Type
Fannie Mae Freddie Mac
Estimated Equity
$167,772
Purchase Details
Closed on
May 28, 2003
Sold by
Bockholt Heidi J
Bought by
Friel Dolores M
Home Financials for this Owner
Home Financials are based on the most recent Mortgage that was taken out on this home.
Original Mortgage
$113,223
Interest Rate
5.3%
Mortgage Type
FHA
Purchase Details
Closed on
Jul 21, 1999
Sold by
St Paul Trust Company
Bought by
Bockholt Heidi J
Home Financials for this Owner
Home Financials are based on the most recent Mortgage that was taken out on this home.
Original Mortgage
$85,500
Interest Rate
7.68%
Create a Home Valuation Report for This Property
The Home Valuation Report is an in-depth analysis detailing your home's value as well as a comparison with similar homes in the area
Home Values in the Area
Average Home Value in this Area
Purchase History
| Date | Buyer | Sale Price | Title Company |
|---|---|---|---|
| Moline Dawn M | $150,000 | Stewart Title Of Illinois | |
| Friel Dolores M | $115,000 | -- | |
| Bockholt Heidi J | $90,000 | -- |
Source: Public Records
Mortgage History
| Date | Status | Borrower | Loan Amount |
|---|---|---|---|
| Open | Moline Dawn M | $70,000 | |
| Previous Owner | Friel Dolores M | $113,223 | |
| Previous Owner | Bockholt Heidi J | $85,500 |
Source: Public Records
Tax History Compared to Growth
Tax History
| Year | Tax Paid | Tax Assessment Tax Assessment Total Assessment is a certain percentage of the fair market value that is determined by local assessors to be the total taxable value of land and additions on the property. | Land | Improvement |
|---|---|---|---|---|
| 2024 | $3,321 | $14,000 | $3,076 | $10,924 |
| 2023 | $2,880 | $14,000 | $3,076 | $10,924 |
| 2022 | $2,880 | $10,825 | $2,692 | $8,133 |
| 2021 | $2,826 | $10,823 | $2,691 | $8,132 |
| 2020 | $2,865 | $10,823 | $2,691 | $8,132 |
| 2019 | $2,664 | $10,782 | $2,435 | $8,347 |
| 2018 | $2,552 | $10,782 | $2,435 | $8,347 |
| 2017 | $2,567 | $10,782 | $2,435 | $8,347 |
| 2016 | $2,414 | $9,345 | $2,050 | $7,295 |
| 2015 | $2,342 | $9,345 | $2,050 | $7,295 |
| 2014 | $1,703 | $9,345 | $2,050 | $7,295 |
| 2013 | $2,714 | $11,503 | $2,050 | $9,453 |
Source: Public Records
Map
Nearby Homes
- 8955 S Corcoran Rd
- 4501 W 90th Place
- 4308 W 91st Place
- 8772 S Kolmar Ave
- 4153 W 89th Place Unit 1
- 4421 W 87th St
- 4530 W 93rd St Unit 2B
- 8928 S Ryan Rd
- 8755 S Corcoran Rd
- 8925 S Main St
- 4560 W 93rd St Unit 2D
- 8912 S Ryan Rd
- 9317 S Kolmar Ave
- 9001 S Cicero Ave Unit 6
- 4133 Southwest Hwy
- 4049 W 89th Place
- 8618 S Kolmar Ave
- 10810 S Kilpatrick Ave Unit 1NE
- 8638 S Keeler Ave
- 9134 S Pulaski Rd Unit 2E
- 9026 S Beck Place
- 9016 S Beck Place
- 9010 S Beck Place
- 9028 S Beck Place
- 9008 S Beck Place
- 9036 S Beck Place
- 9019 S Beck Place
- 9025 S Beck Place
- 9002 S Beck Place
- 9027 S Beck Place
- 9017 S Beck Place
- 9038 S Beck Place
- 9011 S Beck Place
- 9011 S Beck Place Unit 1
- 9033 S Beck Place
- 9035 S Beck Place
- 9009 S Beck Place
- 9000 S Beck Place
- 9041 S Beck Place
- 9003 S Beck Place