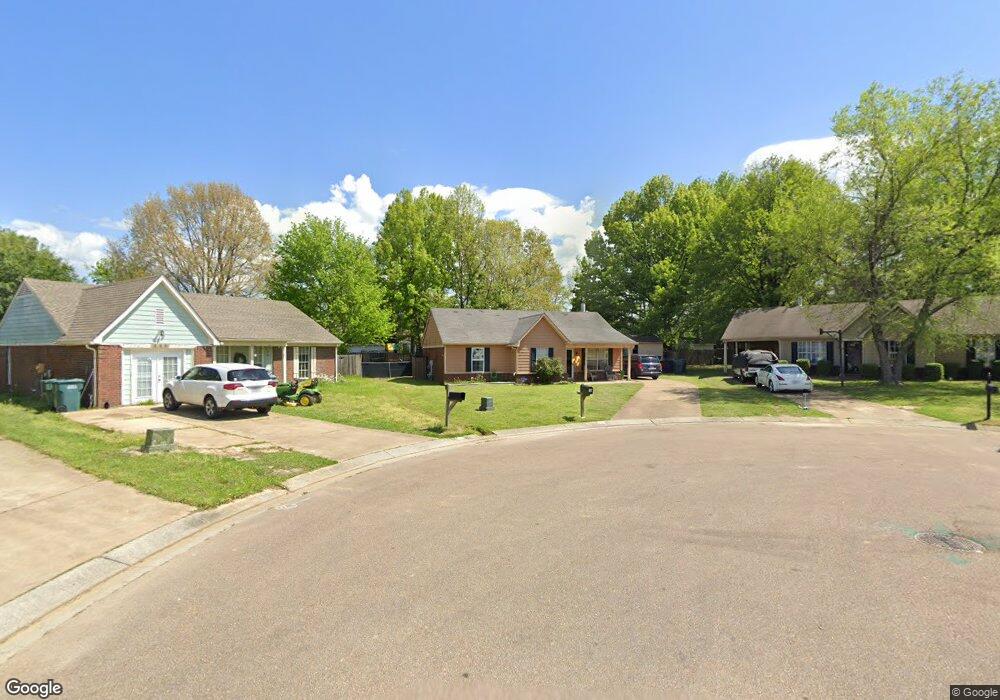
902 Acorn Cove Southaven, MS 38671
Estimated Value: $153,000 - $207,000
3
Beds
2
Baths
1,101
Sq Ft
$163/Sq Ft
Est. Value
About This Home
This home is located at 902 Acorn Cove, Southaven, MS 38671 and is currently estimated at $179,185, approximately $162 per square foot. 902 Acorn Cove is a home located in DeSoto County with nearby schools including Greenbrook Elementary School, Southaven Intermediate School, and Southaven Middle School.
Ownership History
Date
Name
Owned For
Owner Type
Purchase Details
Closed on
Aug 26, 2013
Sold by
D & B Property Investments Llc
Bought by
Marshall Phillip
Current Estimated Value
Home Financials for this Owner
Home Financials are based on the most recent Mortgage that was taken out on this home.
Original Mortgage
$47,473
Interest Rate
4.31%
Mortgage Type
Unknown
Purchase Details
Closed on
Jan 14, 2011
Sold by
Drake James A and Drake Pamela
Bought by
D & B Property Investments Llc
Home Financials for this Owner
Home Financials are based on the most recent Mortgage that was taken out on this home.
Original Mortgage
$56,576
Interest Rate
4.2%
Mortgage Type
Future Advance Clause Open End Mortgage
Purchase Details
Closed on
Nov 18, 2010
Sold by
Secretary Of Housing & Urban Development
Bought by
Drake James A and Drake Pamela
Home Financials for this Owner
Home Financials are based on the most recent Mortgage that was taken out on this home.
Original Mortgage
$56,576
Interest Rate
4.2%
Mortgage Type
Future Advance Clause Open End Mortgage
Create a Home Valuation Report for This Property
The Home Valuation Report is an in-depth analysis detailing your home's value as well as a comparison with similar homes in the area
Home Values in the Area
Average Home Value in this Area
Purchase History
| Date | Buyer | Sale Price | Title Company |
|---|---|---|---|
| Marshall Phillip | -- | None Available | |
| D & B Property Investments Llc | -- | First National Title Llc | |
| Drake James A | -- | None Available |
Source: Public Records
Mortgage History
| Date | Status | Borrower | Loan Amount |
|---|---|---|---|
| Closed | Marshall Phillip | $47,473 | |
| Previous Owner | Drake James A | $56,576 |
Source: Public Records
Tax History Compared to Growth
Tax History
| Year | Tax Paid | Tax Assessment Tax Assessment Total Assessment is a certain percentage of the fair market value that is determined by local assessors to be the total taxable value of land and additions on the property. | Land | Improvement |
|---|---|---|---|---|
| 2024 | $1,606 | $11,041 | $3,000 | $8,041 |
| 2023 | $1,606 | $11,041 | $0 | $0 |
| 2022 | $1,572 | $11,041 | $3,000 | $8,041 |
| 2021 | $1,572 | $11,041 | $3,000 | $8,041 |
| 2020 | $1,481 | $10,398 | $3,000 | $7,398 |
| 2019 | $1,481 | $10,398 | $3,000 | $7,398 |
| 2017 | $1,458 | $17,362 | $10,181 | $7,181 |
| 2016 | $1,458 | $10,181 | $3,000 | $7,181 |
| 2015 | $1,450 | $17,362 | $10,181 | $7,181 |
| 2014 | $1,458 | $10,181 | $0 | $0 |
| 2013 | $974 | $10,181 | $0 | $0 |
Source: Public Records
Map
Nearby Homes
- 754 Valley Springs Dr
- 864 Hackberry Dr
- 8091 Fitler Cove
- 792 Birchfield Place
- 1164 Chestnut Dr
- 1177 Chestnut Dr
- 8355 Greenbrook Pkwy
- 7934 Sycamore Dr
- 413 Country Garden Dr
- 708 Thornwood Dr
- 8615 Bridgewood Dr
- 8644 Woodbine Dr
- 351 Country Garden Dr
- 343 Flower Garden Dr
- 335 Flower Garden Dr
- 327 Flower Garden Dr
- 274 Country Garden Dr
- 266 Country Garden Dr
- 1011 Lexington Loop
- 1019 Lexington Loop
- 898 Acorn Cove
- 904 Acorn Cove
- 8137 Leaf Cove
- 886 Acorn Cove
- 8143 Leaf Cove
- 8138 Leaf Cove
- 901 Acorn Cove
- 897 Acorn Cove
- 901 Long Branch Dr E
- 885 Acorn Cove
- 8150 Long Branch Dr N
- 8153 Leaf Cove
- 8164 Long Branch Dr N
- 8140 Leaf Cove
- 8132 Long Branch Dr N
- 883 Acorn Cove
- 8144 Leaf Cove
- 875 Acorn Cove
- 8154 Leaf Cove
- 902 Long Branch Dr E