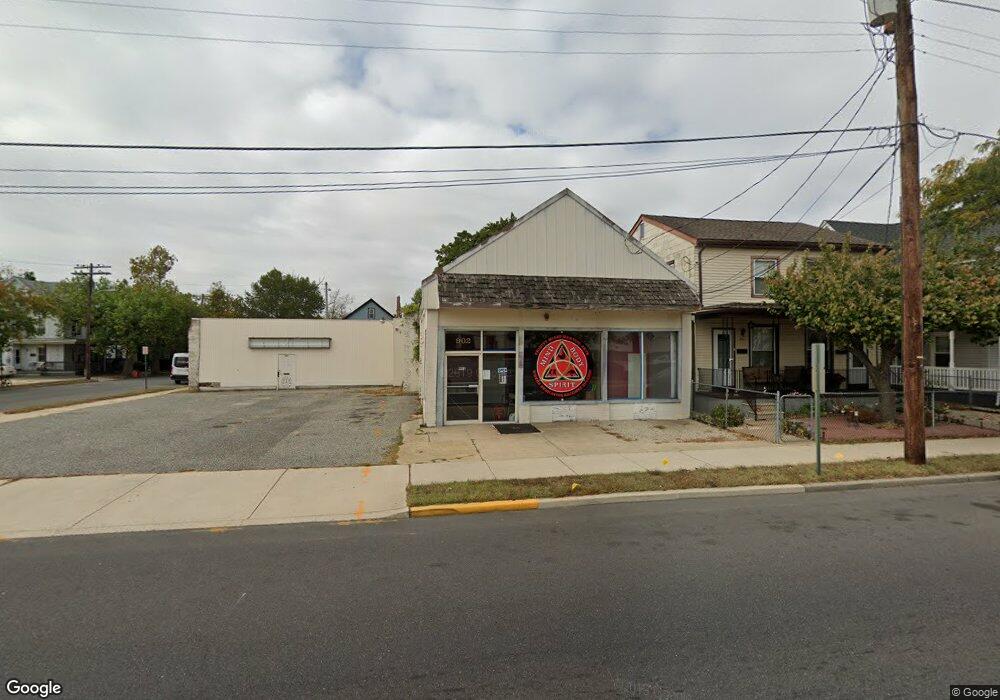
902 N High St Millville, NJ 08332
Estimated Value: $203,653
--
Bed
--
Bath
5,832
Sq Ft
$35/Sq Ft
Est. Value
About This Home
This home is located at 902 N High St, Millville, NJ 08332 and is currently estimated at $203,653, approximately $34 per square foot. 902 N High St is a home located in Cumberland County with nearby schools including R.D. Wood Elementary School, Lakeside Middle School, and Memorial High School.
Ownership History
Date
Name
Owned For
Owner Type
Purchase Details
Closed on
Feb 29, 2024
Sold by
Nj Superior Investment And Rentals Llc
Bought by
Concepcion Angel
Current Estimated Value
Purchase Details
Closed on
Jul 30, 2015
Sold by
Fisher Joseph and Fisher Bernard
Bought by
Nj Superior Investments And Rentals Llc
Home Financials for this Owner
Home Financials are based on the most recent Mortgage that was taken out on this home.
Original Mortgage
$57,750
Interest Rate
4.08%
Mortgage Type
Commercial
Create a Home Valuation Report for This Property
The Home Valuation Report is an in-depth analysis detailing your home's value as well as a comparison with similar homes in the area
Home Values in the Area
Average Home Value in this Area
Purchase History
| Date | Buyer | Sale Price | Title Company |
|---|---|---|---|
| Concepcion Angel | $180,000 | None Listed On Document | |
| Concepcion Angel | $180,000 | None Listed On Document | |
| Nj Superior Investments And Rentals Llc | $77,000 | Beacon Title Services |
Source: Public Records
Mortgage History
| Date | Status | Borrower | Loan Amount |
|---|---|---|---|
| Previous Owner | Nj Superior Investments And Rentals Llc | $57,750 |
Source: Public Records
Tax History Compared to Growth
Tax History
| Year | Tax Paid | Tax Assessment Tax Assessment Total Assessment is a certain percentage of the fair market value that is determined by local assessors to be the total taxable value of land and additions on the property. | Land | Improvement |
|---|---|---|---|---|
| 2025 | $5,142 | $131,000 | $53,400 | $77,600 |
| 2024 | $5,142 | $131,000 | $53,400 | $77,600 |
| 2023 | $5,099 | $131,000 | $53,400 | $77,600 |
| 2022 | $4,966 | $131,000 | $53,400 | $77,600 |
| 2021 | $3,960 | $131,000 | $53,400 | $77,600 |
| 2020 | $4,725 | $131,000 | $53,400 | $77,600 |
| 2019 | $4,506 | $131,000 | $53,400 | $77,600 |
| 2018 | $4,413 | $131,000 | $53,400 | $77,600 |
| 2017 | $4,373 | $131,000 | $53,400 | $77,600 |
| 2016 | $4,318 | $131,000 | $53,400 | $77,600 |
| 2015 | $6,699 | $207,900 | $53,400 | $154,500 |
| 2014 | $6,711 | $207,900 | $53,400 | $154,500 |
Source: Public Records
Map
Nearby Homes