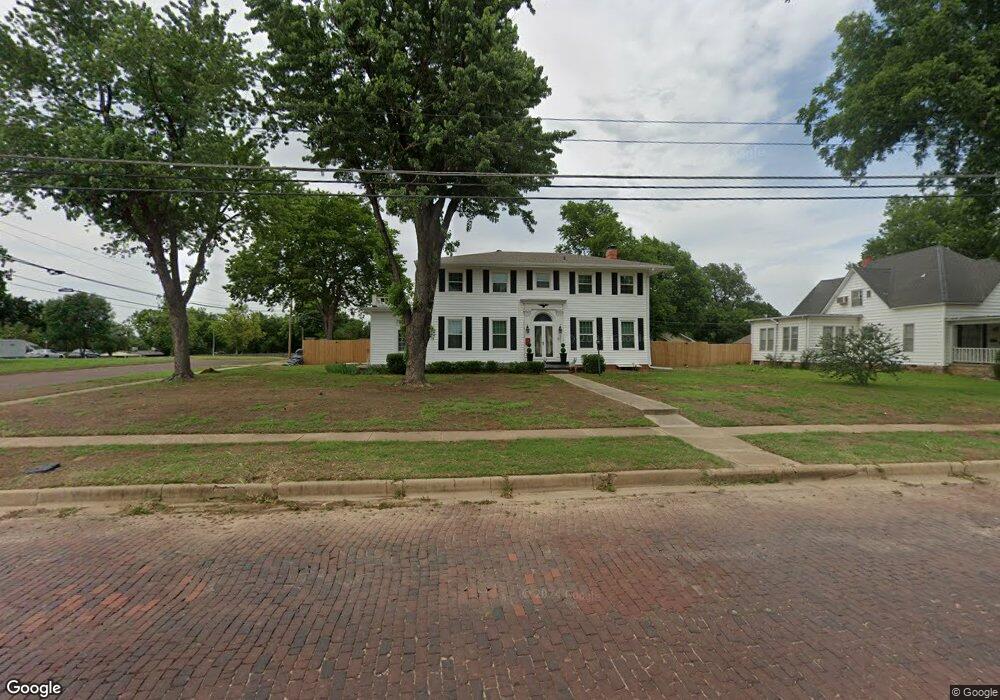
903 E Central Ave Ponca City, OK 74601
Estimated Value: $135,000 - $176,577
5
Beds
2
Baths
2,955
Sq Ft
$54/Sq Ft
Est. Value
About This Home
This home is located at 903 E Central Ave, Ponca City, OK 74601 and is currently estimated at $160,644, approximately $54 per square foot. 903 E Central Ave is a home located in Kay County with nearby schools including Garfield Elementary School, Ponca City East Middle School, and Ponca City West Middle School.
Ownership History
Date
Name
Owned For
Owner Type
Purchase Details
Closed on
Jan 11, 2023
Sold by
Sa Holdings Inc
Bought by
Booth Bruce Edward and Booth Emily Helen
Current Estimated Value
Purchase Details
Closed on
Jun 13, 2022
Sold by
Kelley Steve Sheriff
Bought by
Sa Holdings Inc
Purchase Details
Closed on
Jun 24, 2014
Sold by
Trinh Sinh Han and Trinh Sinh H
Bought by
Johnson Melody L
Home Financials for this Owner
Home Financials are based on the most recent Mortgage that was taken out on this home.
Original Mortgage
$190,577
Interest Rate
4.23%
Mortgage Type
Future Advance Clause Open End Mortgage
Purchase Details
Closed on
Sep 1, 2000
Sold by
Friess John P and Friess Judy A
Bought by
En Sinh H and En Thi Trinh
Purchase Details
Closed on
May 10, 1994
Sold by
Alice Donald E and Alice Lockwood
Bought by
Friess John P and Friess Judy A
Create a Home Valuation Report for This Property
The Home Valuation Report is an in-depth analysis detailing your home's value as well as a comparison with similar homes in the area
Home Values in the Area
Average Home Value in this Area
Purchase History
| Date | Buyer | Sale Price | Title Company |
|---|---|---|---|
| Booth Bruce Edward | $125,000 | -- | |
| Sa Holdings Inc | $95,000 | None Listed On Document | |
| Johnson Melody L | $83,000 | Syewart Escrow & Title | |
| En Sinh H | $186,500 | -- | |
| Friess John P | $162,000 | -- |
Source: Public Records
Mortgage History
| Date | Status | Borrower | Loan Amount |
|---|---|---|---|
| Previous Owner | Johnson Melody L | $190,577 |
Source: Public Records
Tax History Compared to Growth
Tax History
| Year | Tax Paid | Tax Assessment Tax Assessment Total Assessment is a certain percentage of the fair market value that is determined by local assessors to be the total taxable value of land and additions on the property. | Land | Improvement |
|---|---|---|---|---|
| 2024 | $1,341 | $15,164 | $1,355 | $13,809 |
| 2023 | $1,341 | $14,300 | $1,355 | $12,945 |
| 2022 | $1,359 | $14,276 | $1,355 | $12,921 |
| 2021 | $1,365 | $14,276 | $1,355 | $12,921 |
| 2020 | $1,329 | $14,044 | $1,355 | $12,689 |
| 2019 | $1,278 | $13,375 | $1,355 | $12,020 |
| 2018 | $1,233 | $12,738 | $1,355 | $11,383 |
| 2017 | $1,189 | $12,132 | $1,355 | $10,777 |
| 2016 | $1,144 | $11,554 | $1,355 | $10,199 |
| 2015 | $1,095 | $11,004 | $1,355 | $9,649 |
| 2014 | $1,462 | $14,977 | $1,109 | $13,868 |
Source: Public Records
Map
Nearby Homes
- 213 N 10th St
- 310 S 9th St
- 216 N 12th St Unit 840
- 202 N 7th St
- 310 N 7th St Unit 660
- 409 N 5th St
- 410 Drake Dr
- 701 S 8th St
- 408 S 4th St
- 800 S 12th St
- 525 Monument Rd
- 417 N 3rd St
- 212 E Ponca Ave
- 417 S 2nd St
- 214 Virginia Ave
- 1001 S 9th St
- 815 E Madison Ave
- 1020 S 8th St
- 4025 S Union St
- 1103 S 6th St
- 909 E Central Ave
- 902 E Grand Ave
- 912 E Grand Ave
- 921 E Central Ave
- 900 E Central Ave
- 819 E Central Ave
- 916 E Grand Ave
- 908 E Central Ave
- 910 E Central Ave
- 918 E Grand Ave
- 209 S 9th St Unit 80
- 820 E Central Ave
- 211 S 9th St
- 210 S 10th St
- 210 S 9th St
- 913 E Grand Ave
- 201 S 8th St
- 214 S 9th St
- 217 S 9th St
- 919 E Grand Ave