903 Joshua Ct Granbury, TX 76048
Estimated Value: $495,046 - $561,000
3
Beds
2
Baths
2,317
Sq Ft
$229/Sq Ft
Est. Value
About This Home
This home is located at 903 Joshua Ct, Granbury, TX 76048 and is currently estimated at $530,012, approximately $228 per square foot. 903 Joshua Ct is a home located in Hood County with nearby schools including Brawner Elementary School, Acton Middle School, and Granbury High School.
Ownership History
Date
Name
Owned For
Owner Type
Purchase Details
Closed on
Apr 29, 2015
Sold by
Mearstone Properties Lp
Bought by
Allison Gene Nealy and Allison Marcia Gloria
Current Estimated Value
Purchase Details
Closed on
Apr 18, 2013
Sold by
Josiah Ventures Ltd
Bought by
Mearstone Properties Lp
Home Financials for this Owner
Home Financials are based on the most recent Mortgage that was taken out on this home.
Original Mortgage
$52,500
Interest Rate
3.67%
Mortgage Type
Purchase Money Mortgage
Purchase Details
Closed on
Feb 20, 2007
Sold by
Josiah Ventures Ltd
Bought by
Allison Gene Nealy and Allison Marcia Gloria
Create a Home Valuation Report for This Property
The Home Valuation Report is an in-depth analysis detailing your home's value as well as a comparison with similar homes in the area
Home Values in the Area
Average Home Value in this Area
Purchase History
| Date | Buyer | Sale Price | Title Company |
|---|---|---|---|
| Allison Gene Nealy | -- | Rattikin Title | |
| Mearstone Properties Lp | -- | Rattikin Title Northwest | |
| Allison Gene Nealy | -- | -- |
Source: Public Records
Mortgage History
| Date | Status | Borrower | Loan Amount |
|---|---|---|---|
| Previous Owner | Mearstone Properties Lp | $52,500 |
Source: Public Records
Tax History Compared to Growth
Tax History
| Year | Tax Paid | Tax Assessment Tax Assessment Total Assessment is a certain percentage of the fair market value that is determined by local assessors to be the total taxable value of land and additions on the property. | Land | Improvement |
|---|---|---|---|---|
| 2025 | $3,186 | $514,100 | $55,000 | $459,100 |
| 2024 | $3,254 | $485,914 | $55,000 | $484,520 |
| 2023 | $7,076 | $498,550 | $55,000 | $443,550 |
| 2022 | $5,144 | $464,750 | $55,000 | $409,750 |
| 2021 | $7,051 | $365,080 | $45,000 | $320,080 |
| 2020 | $6,589 | $337,470 | $45,000 | $292,470 |
| 2019 | $6,606 | $326,220 | $45,000 | $281,220 |
| 2018 | $6,015 | $297,010 | $45,000 | $252,010 |
| 2017 | $5,595 | $270,320 | $40,000 | $230,320 |
| 2016 | $5,285 | $255,320 | $25,000 | $230,320 |
| 2015 | $257 | $230,560 | $25,000 | $205,560 |
| 2014 | $257 | $12,500 | $12,500 | $0 |
Source: Public Records
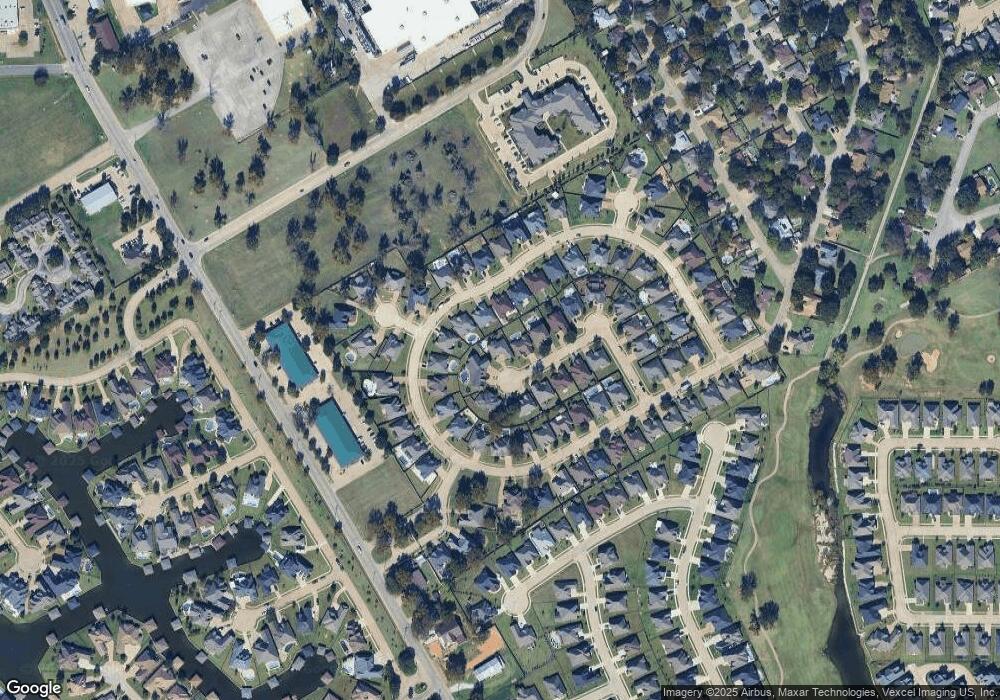
Map
Nearby Homes
- 906 Joshua Ct
- 3012 Reed Ct
- 1203 Huntington Cove Ct
- 1124 Dove Hollow Rd
- 1209 Catalina Bay Blvd
- 2041 Clive Dr
- 1112 Sunset Bay Dr
- 900 Pate St
- 2414 Vineyard Dr
- 1300 Highland Park Cir
- 1012 Hayden Ct
- 1016 Hayden Ct
- 1501 Chelsea Bay Ct
- 2208 Waters Edge Dr
- 1102 Holiday Ct
- 1003 Dawn Ct
- 1403 Amsterdam Ct
- 1006 Teresa Ct
- 1000 Teresa Ct
- 1214 Mallard Way