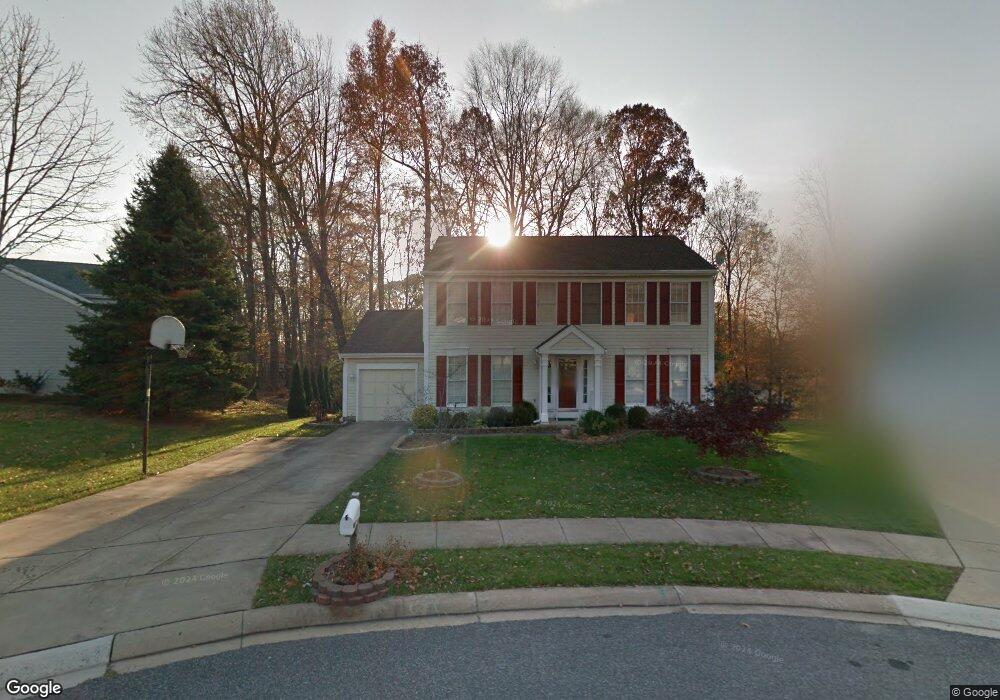
903 Mitchum Ct Bel Air, MD 21014
Estimated Value: $493,996 - $618,000
--
Bed
2
Baths
2,144
Sq Ft
$253/Sq Ft
Est. Value
About This Home
This home is located at 903 Mitchum Ct, Bel Air, MD 21014 and is currently estimated at $542,749, approximately $253 per square foot. 903 Mitchum Ct is a home located in Harford County with nearby schools including Red Pump Elementary School, Fallston Middle School, and Fallston High School.
Ownership History
Date
Name
Owned For
Owner Type
Purchase Details
Closed on
May 9, 1989
Sold by
Ryan Operations Gp
Bought by
Charintranont Koompol and Charintranont Nilda
Current Estimated Value
Home Financials for this Owner
Home Financials are based on the most recent Mortgage that was taken out on this home.
Original Mortgage
$126,150
Interest Rate
10.97%
Purchase Details
Closed on
Mar 10, 1989
Sold by
Brentwood Park Inc
Bought by
Ryan Operations Gp
Home Financials for this Owner
Home Financials are based on the most recent Mortgage that was taken out on this home.
Original Mortgage
$126,150
Interest Rate
10.97%
Create a Home Valuation Report for This Property
The Home Valuation Report is an in-depth analysis detailing your home's value as well as a comparison with similar homes in the area
Home Values in the Area
Average Home Value in this Area
Purchase History
| Date | Buyer | Sale Price | Title Company |
|---|---|---|---|
| Charintranont Koompol | $157,700 | -- | |
| Ryan Operations Gp | $36,100 | -- |
Source: Public Records
Mortgage History
| Date | Status | Borrower | Loan Amount |
|---|---|---|---|
| Closed | Charintranont Koompol | $126,150 |
Source: Public Records
Tax History Compared to Growth
Tax History
| Year | Tax Paid | Tax Assessment Tax Assessment Total Assessment is a certain percentage of the fair market value that is determined by local assessors to be the total taxable value of land and additions on the property. | Land | Improvement |
|---|---|---|---|---|
| 2025 | $4,317 | $417,500 | $111,300 | $306,200 |
| 2024 | $3,851 | $396,100 | $0 | $0 |
| 2023 | $3,851 | $374,700 | $0 | $0 |
| 2022 | $3,851 | $353,300 | $111,300 | $242,000 |
| 2021 | $3,875 | $344,533 | $0 | $0 |
| 2020 | $3,875 | $335,767 | $0 | $0 |
| 2019 | $3,774 | $327,000 | $127,100 | $199,900 |
| 2018 | $3,680 | $321,767 | $0 | $0 |
| 2017 | $3,620 | $327,000 | $0 | $0 |
| 2016 | -- | $311,300 | $0 | $0 |
| 2015 | $3,398 | $304,533 | $0 | $0 |
| 2014 | $3,398 | $297,767 | $0 | $0 |
Source: Public Records
Map
Nearby Homes
- 817 Peppard Dr
- 903 Garland Ct
- 711 Eastwood Ct
- 1004 Downing Ct Unit 16
- 904 Martell Ct Unit E
- 1217 Grafton Shop Rd
- 902 Shephard Ct
- 1516 Cedarwood Dr
- 1322 Locust Ave
- 1346 Vanderbilt Rd
- 1353 Sweetbriar Ln
- 1205 Bear Hollow Ct
- 222 Steed Ln
- 1208 Saint Francis Rd
- 400 Birchwood Manor Ln
- 752 Roland Ave
- 747 Roland Ave
- 202 Princeton Ln
- 636 Wallingford Rd Unit 2H
- 636 Wallingford Rd Unit 2C
- 901 Peppard Dr
- 901 Mitchum Ct
- 903 Peppard Dr
- 907 Red Pump Rd
- 900 Mitchum Ct
- 905 Red Pump Rd
- 906 Mitchum Ct
- 905 Peppard Dr
- 902 Mitchum Ct
- 900 Peppard Dr
- 903 Red Pump Rd
- 904 Mitchum Ct
- 912 Garland Ct
- 907 Peppard Dr
- 823 Peppard Dr
- 820 Peppard Dr
- 910 Garland Ct
- 821 Peppard Dr
- 951 Red Pump Rd
- 909 Peppard Dr