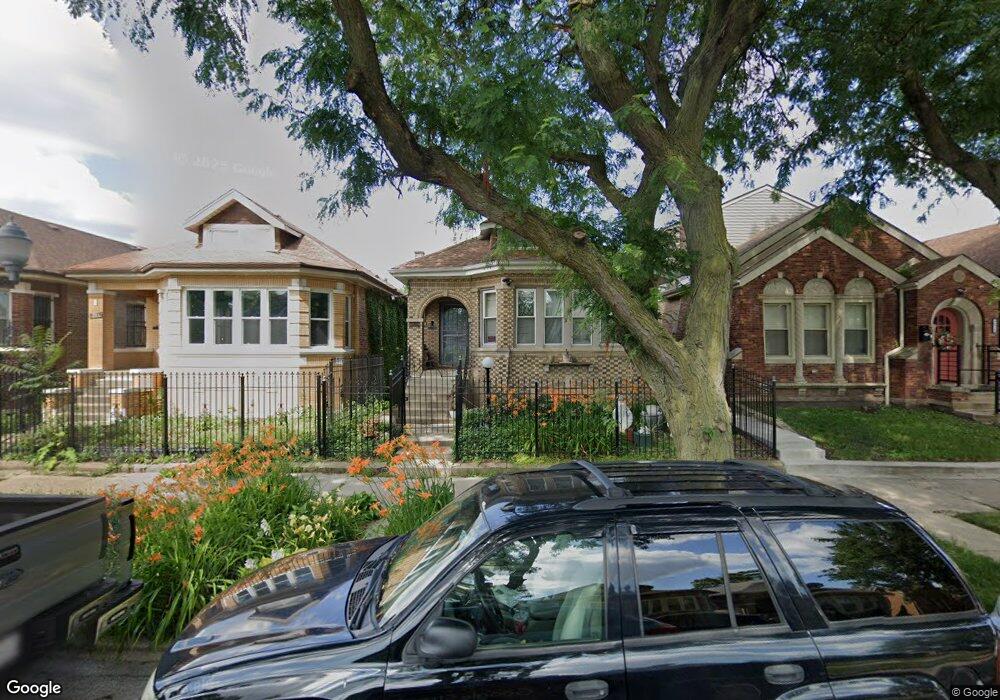
9030 S May St Chicago, IL 60620
Brainerd NeighborhoodEstimated Value: $224,000 - $258,000
3
Beds
2
Baths
1,411
Sq Ft
$171/Sq Ft
Est. Value
About This Home
This home is located at 9030 S May St, Chicago, IL 60620 and is currently estimated at $240,963, approximately $170 per square foot. 9030 S May St is a home located in Cook County with nearby schools including Mahalia Jackson Elementary School, Harlan Community Academy High School, and CICS - Longwood Campus.
Ownership History
Date
Name
Owned For
Owner Type
Purchase Details
Closed on
Aug 18, 1999
Sold by
American National Bk & Tr Of Chicago
Bought by
Pitts Yvette B
Current Estimated Value
Home Financials for this Owner
Home Financials are based on the most recent Mortgage that was taken out on this home.
Original Mortgage
$98,239
Outstanding Balance
$28,341
Interest Rate
7.7%
Mortgage Type
FHA
Estimated Equity
$212,622
Purchase Details
Closed on
May 4, 1999
Sold by
South Suburban Humane Society
Bought by
American National Bk & Tr Co Of Chicago and Trust #117895-00
Purchase Details
Closed on
Oct 28, 1998
Sold by
Hud
Bought by
South Suburban Humane Society
Purchase Details
Closed on
Feb 9, 1994
Sold by
Old Kent Bank
Bought by
Brown Venus V
Purchase Details
Closed on
Sep 10, 1993
Sold by
Associates Finance Inc
Bought by
Sheffield Capital Partners Ltd
Home Financials for this Owner
Home Financials are based on the most recent Mortgage that was taken out on this home.
Original Mortgage
$32,400
Interest Rate
7.22%
Create a Home Valuation Report for This Property
The Home Valuation Report is an in-depth analysis detailing your home's value as well as a comparison with similar homes in the area
Home Values in the Area
Average Home Value in this Area
Purchase History
| Date | Buyer | Sale Price | Title Company |
|---|---|---|---|
| Pitts Yvette B | $99,000 | -- | |
| American National Bk & Tr Co Of Chicago | -- | -- | |
| South Suburban Humane Society | -- | -- | |
| Brown Venus V | $53,333 | -- | |
| Sheffield Capital Partners Ltd | $24,000 | -- |
Source: Public Records
Mortgage History
| Date | Status | Borrower | Loan Amount |
|---|---|---|---|
| Open | Pitts Yvette B | $98,239 | |
| Previous Owner | Sheffield Capital Partners Ltd | $32,400 |
Source: Public Records
Tax History Compared to Growth
Tax History
| Year | Tax Paid | Tax Assessment Tax Assessment Total Assessment is a certain percentage of the fair market value that is determined by local assessors to be the total taxable value of land and additions on the property. | Land | Improvement |
|---|---|---|---|---|
| 2024 | $2,260 | $14,001 | $3,563 | $10,438 |
| 2023 | $2,182 | $14,001 | $2,813 | $11,188 |
| 2022 | $2,182 | $14,001 | $2,813 | $11,188 |
| 2021 | $2,151 | $13,999 | $2,812 | $11,187 |
| 2020 | $2,322 | $13,502 | $2,812 | $10,690 |
| 2019 | $2,298 | $14,838 | $2,812 | $12,026 |
| 2018 | $2,258 | $14,838 | $2,812 | $12,026 |
| 2017 | $2,170 | $13,435 | $2,437 | $10,998 |
| 2016 | $2,196 | $13,435 | $2,437 | $10,998 |
| 2015 | $1,986 | $13,435 | $2,437 | $10,998 |
| 2014 | $1,857 | $12,551 | $2,250 | $10,301 |
| 2013 | $1,809 | $12,551 | $2,250 | $10,301 |
Source: Public Records
Map
Nearby Homes
- 1114 W 90th St
- 8922 S May St
- 8949 S Elizabeth St
- 9101 S Racine Ave
- 8924 S Elizabeth St
- 9015 S Carpenter St
- 9107 S Aberdeen St
- 9002 S Morgan St
- 8841 S Elizabeth St
- 8914 S Throop St
- 8836 S Carpenter St
- 9154 S May St
- 8810 S Racine Ave
- 9051 S Ada St
- 8817 S Elizabeth St
- 9129 S Carpenter St
- 1146 W 88th St
- 8817 S Morgan St
- 8822 S Ada St
- 9240 S Aberdeen St
- 9026 S May St
- 9032 S May St
- 9036 S May St
- 9024 S May St
- 9038 S May St
- 9020 S May St
- 9042 S May St
- 9018 S May St
- 9031 S Racine Ave
- 9027 S Racine Ave
- 9033 S Racine Ave
- 9025 S Racine Ave
- 9035 S Racine Ave
- 9044 S May St
- 9014 S May St
- 9023 S Racine Ave
- 9039 S Racine Ave
- 9033 S May St
- 9041 S Racine Ave
- 9046 S May St