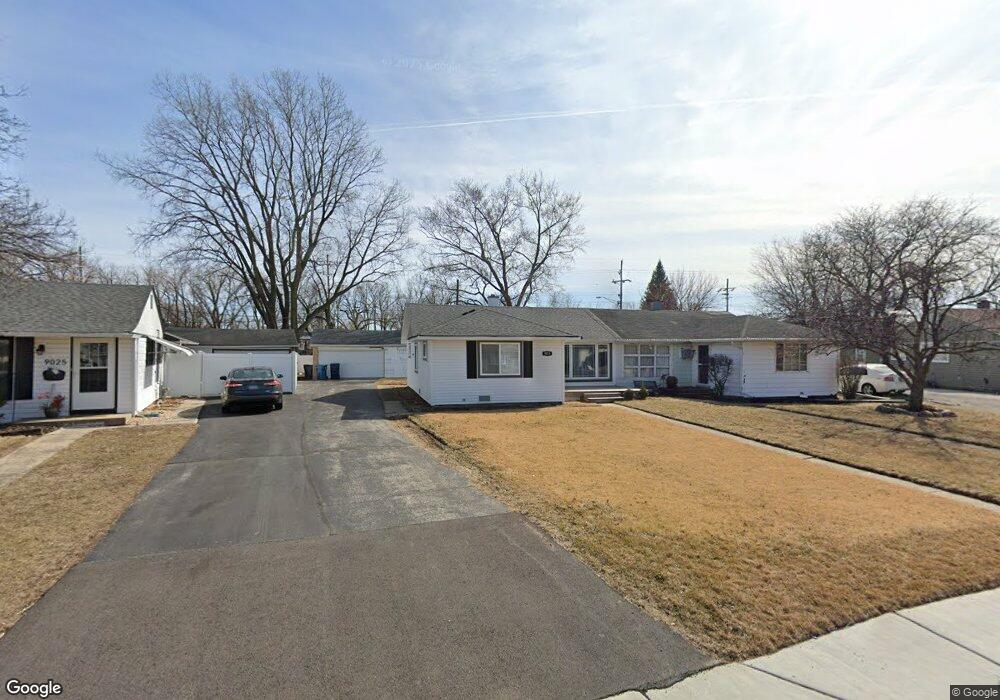
9031 S Corcoran Rd Hometown, IL 60456
Estimated Value: $163,000 - $235,000
3
Beds
1
Bath
1,100
Sq Ft
$191/Sq Ft
Est. Value
About This Home
This home is located at 9031 S Corcoran Rd, Hometown, IL 60456 and is currently estimated at $209,722, approximately $190 per square foot. 9031 S Corcoran Rd is a home located in Cook County with nearby schools including Hometown Elementary School, J Covington Elementary School, and Sward Elementary School.
Ownership History
Date
Name
Owned For
Owner Type
Purchase Details
Closed on
Apr 1, 2020
Sold by
Freedom Mortgage Corporation
Bought by
Luckett Kevin Richard and Sims Luckett Amy
Current Estimated Value
Purchase Details
Closed on
Oct 29, 2019
Sold by
Tesar Linda J and Tesar Linda
Bought by
Freedom Mortgage Corporation
Purchase Details
Closed on
Dec 7, 2007
Sold by
West Kathleen
Bought by
Tesar Linda J
Home Financials for this Owner
Home Financials are based on the most recent Mortgage that was taken out on this home.
Original Mortgage
$160,481
Interest Rate
6.31%
Mortgage Type
FHA
Purchase Details
Closed on
Nov 18, 2003
Sold by
Petersen Michael L and Petersen James L
Bought by
West Kathleen M
Home Financials for this Owner
Home Financials are based on the most recent Mortgage that was taken out on this home.
Original Mortgage
$107,200
Interest Rate
6.01%
Mortgage Type
Unknown
Create a Home Valuation Report for This Property
The Home Valuation Report is an in-depth analysis detailing your home's value as well as a comparison with similar homes in the area
Home Values in the Area
Average Home Value in this Area
Purchase History
| Date | Buyer | Sale Price | Title Company |
|---|---|---|---|
| Luckett Kevin Richard | $95,050 | Mortgage Connect Lp | |
| Freedom Mortgage Corporation | -- | Chicago Title | |
| Tesar Linda J | $163,000 | Pntn | |
| West Kathleen M | $134,000 | Atgf Inc |
Source: Public Records
Mortgage History
| Date | Status | Borrower | Loan Amount |
|---|---|---|---|
| Previous Owner | Tesar Linda J | $160,481 | |
| Previous Owner | West Kathleen M | $107,200 | |
| Closed | West Kathleen M | $26,800 |
Source: Public Records
Tax History Compared to Growth
Tax History
| Year | Tax Paid | Tax Assessment Tax Assessment Total Assessment is a certain percentage of the fair market value that is determined by local assessors to be the total taxable value of land and additions on the property. | Land | Improvement |
|---|---|---|---|---|
| 2024 | $4,741 | $15,250 | $4,250 | $11,000 |
| 2023 | $4,267 | $15,250 | $4,250 | $11,000 |
| 2022 | $4,267 | $10,967 | $3,719 | $7,248 |
| 2021 | $4,137 | $10,967 | $3,719 | $7,248 |
| 2020 | $2,918 | $10,967 | $3,719 | $7,248 |
| 2019 | $3,115 | $12,026 | $3,364 | $8,662 |
| 2018 | $2,984 | $12,026 | $3,364 | $8,662 |
| 2017 | $2,999 | $12,026 | $3,364 | $8,662 |
| 2016 | $3,131 | $11,376 | $2,833 | $8,543 |
| 2015 | $3,050 | $11,376 | $2,833 | $8,543 |
| 2014 | $3,921 | $11,376 | $2,833 | $8,543 |
| 2013 | $2,345 | $12,173 | $2,833 | $9,340 |
Source: Public Records
Map
Nearby Homes
- 8955 S Corcoran Rd
- 4501 W 90th Place
- 4308 W 91st Place
- 4153 W 89th Place Unit 1
- 4530 W 93rd St Unit 2B
- 4560 W 93rd St Unit 2D
- 8928 S Ryan Rd
- 8925 S Main St
- 9317 S Kolmar Ave
- 8772 S Kolmar Ave
- 8912 S Ryan Rd
- 8755 S Corcoran Rd
- 4049 W 89th Place
- 4133 Southwest Hwy
- 4421 W 87th St
- 9001 S Cicero Ave Unit 6
- 9001 S Cicero Ave Unit 116
- 9134 S Pulaski Rd Unit 2E
- 8638 S Keeler Ave
- 8618 S Kolmar Ave
- 9033 S Corcoran Rd
- 9023 S Corcoran Rd
- 9039 S Corcoran Rd
- 9017 S Corcoran Rd Unit 2
- 9041 S Corcoran Rd
- 9015 S Corcoran Rd
- 9047 S Corcoran Rd
- 9026 S Corcoran Rd
- 9028 S Corcoran Rd
- 9036 S Corcoran Rd
- 9009 S Corcoran Rd
- 9049 S Corcoran Rd
- 9016 S Corcoran Rd
- 9038 S Corcoran Rd
- 9007 S Corcoran Rd
- 9055 S Corcoran Rd
- 9010 S Corcoran Rd
- 9046 S Corcoran Rd
- 9008 S Corcoran Rd