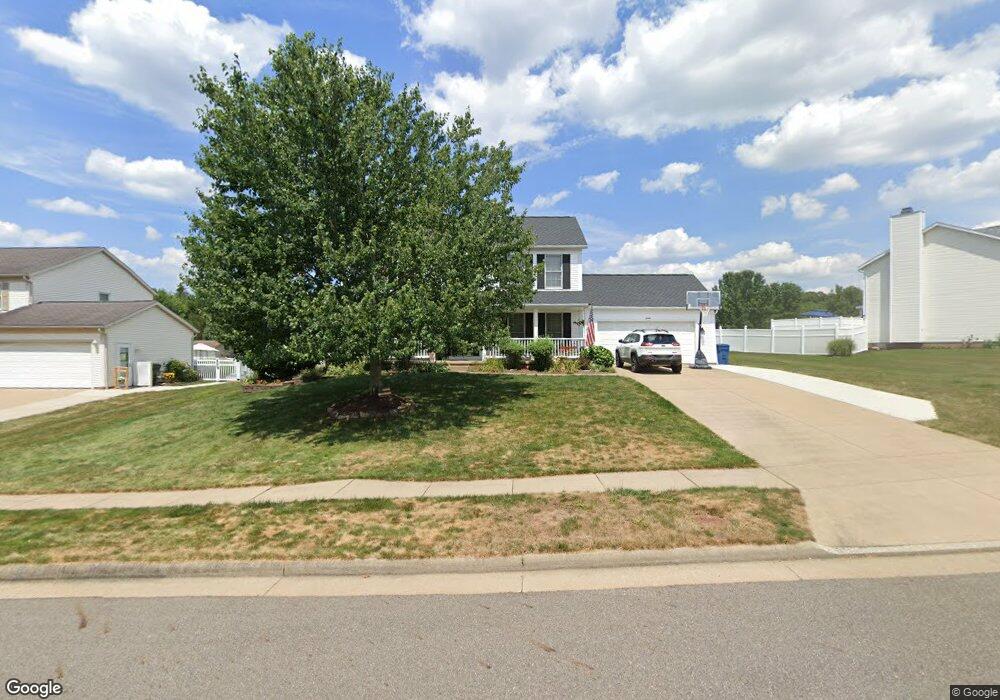
905 Crosswyck Cir Louisville, OH 44641
Estimated Value: $280,589 - $342,000
4
Beds
3
Baths
1,832
Sq Ft
$174/Sq Ft
Est. Value
About This Home
This home is located at 905 Crosswyck Cir, Louisville, OH 44641 and is currently estimated at $319,147, approximately $174 per square foot. 905 Crosswyck Cir is a home located in Stark County with nearby schools including Louisville High School and St. Thomas Aquinas High School & Middle School.
Ownership History
Date
Name
Owned For
Owner Type
Purchase Details
Closed on
Oct 28, 2002
Sold by
Elson J Hershberger Construction Inc
Bought by
Ott Kevin R and Emmons Kelly S
Current Estimated Value
Home Financials for this Owner
Home Financials are based on the most recent Mortgage that was taken out on this home.
Original Mortgage
$161,500
Interest Rate
6.13%
Mortgage Type
Purchase Money Mortgage
Purchase Details
Closed on
May 3, 2001
Sold by
Mckinley Development Company
Bought by
Elson J Hershberger Construction Inc
Home Financials for this Owner
Home Financials are based on the most recent Mortgage that was taken out on this home.
Original Mortgage
$175,000
Interest Rate
7.23%
Mortgage Type
Stand Alone Second
Create a Home Valuation Report for This Property
The Home Valuation Report is an in-depth analysis detailing your home's value as well as a comparison with similar homes in the area
Home Values in the Area
Average Home Value in this Area
Purchase History
| Date | Buyer | Sale Price | Title Company |
|---|---|---|---|
| Ott Kevin R | $161,500 | Midland Commerce Group | |
| Elson J Hershberger Construction Inc | $33,900 | Midland Commerce Group |
Source: Public Records
Mortgage History
| Date | Status | Borrower | Loan Amount |
|---|---|---|---|
| Closed | Ott Kevin R | $161,500 | |
| Closed | Elson J Hershberger Construction Inc | $175,000 |
Source: Public Records
Tax History Compared to Growth
Tax History
| Year | Tax Paid | Tax Assessment Tax Assessment Total Assessment is a certain percentage of the fair market value that is determined by local assessors to be the total taxable value of land and additions on the property. | Land | Improvement |
|---|---|---|---|---|
| 2025 | -- | $81,240 | $31,050 | $50,190 |
| 2024 | -- | $81,240 | $31,050 | $50,190 |
| 2023 | $2,697 | $62,760 | $18,380 | $44,380 |
| 2022 | $1,351 | $62,760 | $18,380 | $44,380 |
| 2021 | $2,710 | $62,760 | $18,380 | $44,380 |
| 2020 | $2,272 | $57,130 | $16,560 | $40,570 |
| 2019 | $2,281 | $59,330 | $16,560 | $42,770 |
| 2018 | $2,360 | $59,330 | $16,560 | $42,770 |
| 2017 | $2,070 | $50,200 | $12,990 | $37,210 |
| 2016 | $2,112 | $50,200 | $12,990 | $37,210 |
| 2015 | $2,118 | $50,200 | $12,990 | $37,210 |
| 2014 | $62 | $45,430 | $11,760 | $33,670 |
| 2013 | $1,035 | $45,430 | $11,760 | $33,670 |
Source: Public Records
Map
Nearby Homes
- 910 Crosswyck Cir
- 1170 Winding Ridge Ave
- 316 E Reno Dr
- 428 Honeycrisp Dr NE
- 3047 Mcintosh Dr NE
- 432 Honeycrisp Dr NE
- 2962 Mcintosh Dr NE
- 2963 Mcintosh Dr NE
- 430 Honeycrisp Dr NE
- 2957 Mcintosh Dr NE
- 5474 Ravenna Ave
- 0 Michigan Blvd
- 325 Lincoln Ave
- 300 Kennedy St
- 524 Glenbar St
- 614 Reno Dr
- 0 Glenbar St
- 308 Superior St
- 0 Brookridge Ave
- 2015 E Main St
- 819 Crosswyck Cir
- 917 Crosswyck Cir
- 1004 E Reno Dr
- 811 Crosswyck Cir
- 902 Crosswyck Cir
- 916 Crosswyck Cir
- 814 Crosswyck Cir
- 1002 Crosswyck Cir
- 805 Crosswyck Cir
- 1282 Winding Ridge Ave
- 1296 Winding Ridge Ave
- 1274 Winding Ridge Ave
- 806 Crosswyck Cir
- 800 Crosswyck Cir
- 1266 Winding Ridge Ave
- 1222 Falling Brook Cir
- 1191 Winding Ridge Ave
- 1204 Falling Brook Cir
- 1009 E Reno Dr
- 923 E Reno Dr