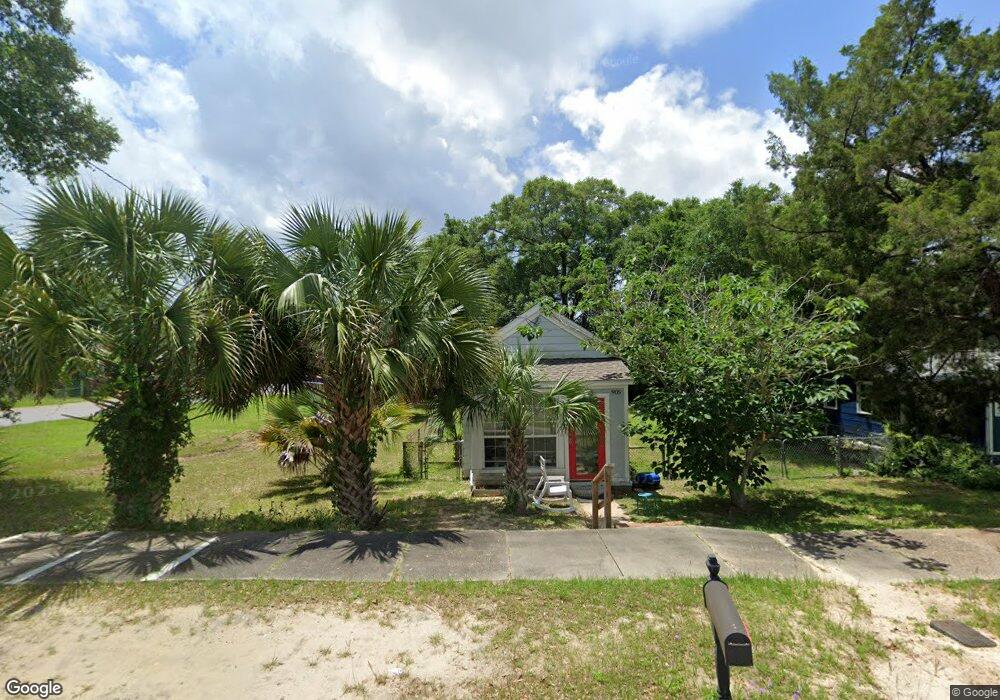
905 W Belmont St Pensacola, FL 32501
Estimated Value: $141,000 - $250,000
--
Bed
1
Bath
1,031
Sq Ft
$183/Sq Ft
Est. Value
About This Home
This home is located at 905 W Belmont St, Pensacola, FL 32501 and is currently estimated at $189,059, approximately $183 per square foot. 905 W Belmont St is a home located in Escambia County with nearby schools including J.H. Workman Middle School, Pensacola High School, and Episcopal Day School of Christ Church Parish.
Ownership History
Date
Name
Owned For
Owner Type
Purchase Details
Closed on
Dec 4, 2018
Sold by
Gulf Holdings Llc
Bought by
Lower Alabama Holdings Llc
Current Estimated Value
Purchase Details
Closed on
Aug 3, 2018
Sold by
May Lutimothy Ivan
Bought by
Bay To Gulf Holdigns Llc
Purchase Details
Closed on
Jan 24, 2018
Sold by
May Lutimothy Ivan
Bought by
May Lutimothy Ivan and Lutimothy Ivan May Sr Revocabl
Purchase Details
Closed on
Aug 10, 2007
Sold by
Rich Elizabeth
Bought by
May Lutimothy
Create a Home Valuation Report for This Property
The Home Valuation Report is an in-depth analysis detailing your home's value as well as a comparison with similar homes in the area
Home Values in the Area
Average Home Value in this Area
Purchase History
| Date | Buyer | Sale Price | Title Company |
|---|---|---|---|
| Lower Alabama Holdings Llc | -- | Achieve Title Services Llc | |
| Bay To Gulf Holdigns Llc | -- | Attorney | |
| Bay To Gulf Kholdings Llc | $55,000 | None Available | |
| May Lutimothy Ivan | -- | Attorney | |
| May Lutimothy | -- | None Available |
Source: Public Records
Tax History Compared to Growth
Tax History
| Year | Tax Paid | Tax Assessment Tax Assessment Total Assessment is a certain percentage of the fair market value that is determined by local assessors to be the total taxable value of land and additions on the property. | Land | Improvement |
|---|---|---|---|---|
| 2024 | $1,405 | $99,194 | $46,913 | $52,281 |
| 2023 | $1,405 | $74,509 | $0 | $0 |
| 2022 | $1,260 | $81,689 | $37,530 | $44,159 |
| 2021 | $1,127 | $64,923 | $0 | $0 |
| 2020 | $996 | $55,981 | $0 | $0 |
| 2019 | $965 | $53,833 | $0 | $0 |
| 2018 | $848 | $51,686 | $0 | $0 |
| 2017 | $738 | $39,401 | $0 | $0 |
| 2016 | $733 | $38,552 | $0 | $0 |
| 2015 | $757 | $39,401 | $0 | $0 |
| 2014 | $737 | $37,975 | $0 | $0 |
Source: Public Records
Map
Nearby Homes