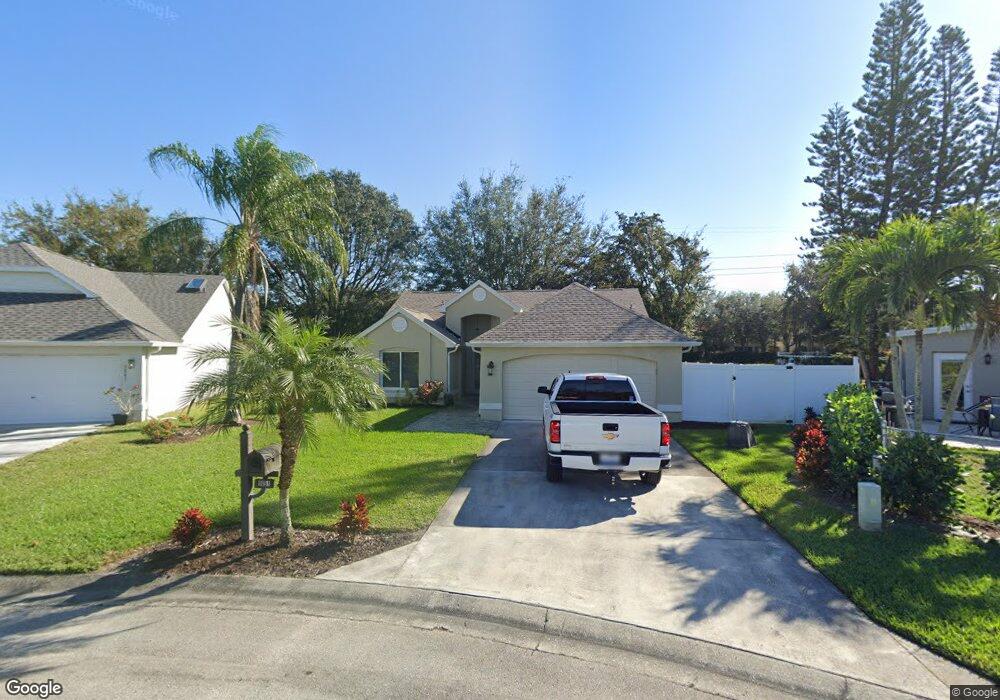
9051 Lightning Bug Ct Fort Myers, FL 33919
Estimated Value: $346,000 - $440,000
3
Beds
2
Baths
1,353
Sq Ft
$278/Sq Ft
Est. Value
About This Home
This home is located at 9051 Lightning Bug Ct, Fort Myers, FL 33919 and is currently estimated at $375,962, approximately $277 per square foot. 9051 Lightning Bug Ct is a home located in Lee County with nearby schools including Orangewood Elementary School, Allen Park Elementary School, and Edison Park Creative & Expressive Arts School.
Ownership History
Date
Name
Owned For
Owner Type
Purchase Details
Closed on
Jul 18, 2025
Sold by
Betts John C and Betts Patricia T
Bought by
John C Betts And Patricia T Betts Revocable T and Betts
Current Estimated Value
Purchase Details
Closed on
Jan 29, 2013
Sold by
Boers Peter A and Boers Stefanie C
Bought by
Betts John C and Betts Patricia T
Purchase Details
Closed on
Apr 24, 1998
Sold by
Leichus Lesley H and Keyes Laura J
Bought by
Boers Peter A and Boers Stefanie C
Home Financials for this Owner
Home Financials are based on the most recent Mortgage that was taken out on this home.
Original Mortgage
$83,000
Interest Rate
7.09%
Purchase Details
Closed on
Oct 4, 1993
Sold by
Leichus Lesley H and Craig Susan L
Bought by
Leichus Lesley H and Keyes Laura J
Home Financials for this Owner
Home Financials are based on the most recent Mortgage that was taken out on this home.
Original Mortgage
$57,500
Interest Rate
7.01%
Create a Home Valuation Report for This Property
The Home Valuation Report is an in-depth analysis detailing your home's value as well as a comparison with similar homes in the area
Home Values in the Area
Average Home Value in this Area
Purchase History
| Date | Buyer | Sale Price | Title Company |
|---|---|---|---|
| John C Betts And Patricia T Betts Revocable T | $100 | Opinion Of Title | |
| Betts John C | $155,000 | Old Florida Title | |
| Boers Peter A | $120,000 | -- | |
| Leichus Lesley H | -- | -- |
Source: Public Records
Mortgage History
| Date | Status | Borrower | Loan Amount |
|---|---|---|---|
| Previous Owner | Boers Peter A | $83,000 | |
| Previous Owner | Leichus Lesley H | $57,500 |
Source: Public Records
Tax History Compared to Growth
Tax History
| Year | Tax Paid | Tax Assessment Tax Assessment Total Assessment is a certain percentage of the fair market value that is determined by local assessors to be the total taxable value of land and additions on the property. | Land | Improvement |
|---|---|---|---|---|
| 2025 | $4,265 | $372,346 | $294,334 | $75,410 |
| 2024 | $4,265 | $251,469 | -- | -- |
| 2023 | $3,875 | $228,608 | $0 | $0 |
| 2022 | $3,398 | $207,825 | $0 | $0 |
| 2021 | $2,904 | $188,932 | $51,590 | $137,342 |
| 2020 | $2,842 | $181,696 | $47,000 | $134,696 |
| 2019 | $2,814 | $178,455 | $41,000 | $137,455 |
| 2018 | $2,912 | $180,878 | $41,000 | $139,878 |
| 2017 | $3,009 | $184,114 | $41,000 | $143,114 |
| 2016 | $2,793 | $166,489 | $41,000 | $125,489 |
| 2015 | $2,610 | $151,203 | $48,000 | $103,203 |
| 2014 | -- | $149,490 | $26,000 | $123,490 |
| 2013 | -- | $130,889 | $22,000 | $108,889 |
Source: Public Records
Map
Nearby Homes
- 15009 Cloverdale Dr
- 15134 Cloverdale Dr
- 3978 Ascot Ln
- 15153 Oxford Cove Unit 2304
- 15157 Oxford Cove Unit 2404
- 15114 Palm Isle Dr
- 15161 Royal Windsor Ln Unit 2603
- 15270 Cricket Ln
- 15258 Cricket Ln
- 15201 Royal Windsor Ln Unit 403
- 9190 Butterfly Ct
- 15249 Avalon Bay Blvd Unit 2903
- 14831 Blackbird Ln
- 8765 Lateen Ln Unit 203
- 15050 Lakeside View Dr Unit 1003
- 9242 Coral Isle Way
- 6859 Carmelle Dr
- 14870 Crystal Cove Ct Unit 203
- 14850 Crystal Cove Ct Unit 402
- 15000 Bridgeway Ln Unit 208
- 15330 Cricket Ln
- 15326 Cricket Ln
- 9040 Lightning Bug Ct
- 15322 Cricket Ln
- 9050 Lightning Bug Ct
- 15340 Cricket Ln
- 15318 Cricket Ln
- 15323 Cricket Ln
- 9051 Quail Ct
- 9040 Quail Ct
- 15331 Cricket Ln
- 15185 Cricket Ln
- 15141 Royal Windsor Ln Unit 2102
- 15141 Royal Windsor Ln Unit 2101
- 15314 Cricket Ln
- 15141 Royal Windsr Ln Unit 2102
- 15141 Royal Windsr Ln Unit 2104
- 15141 Royal Windsr Ln Unit 2101
- 15141 Royal Windsr Ln Unit 2103
- 15131 Royal Windsor Ln