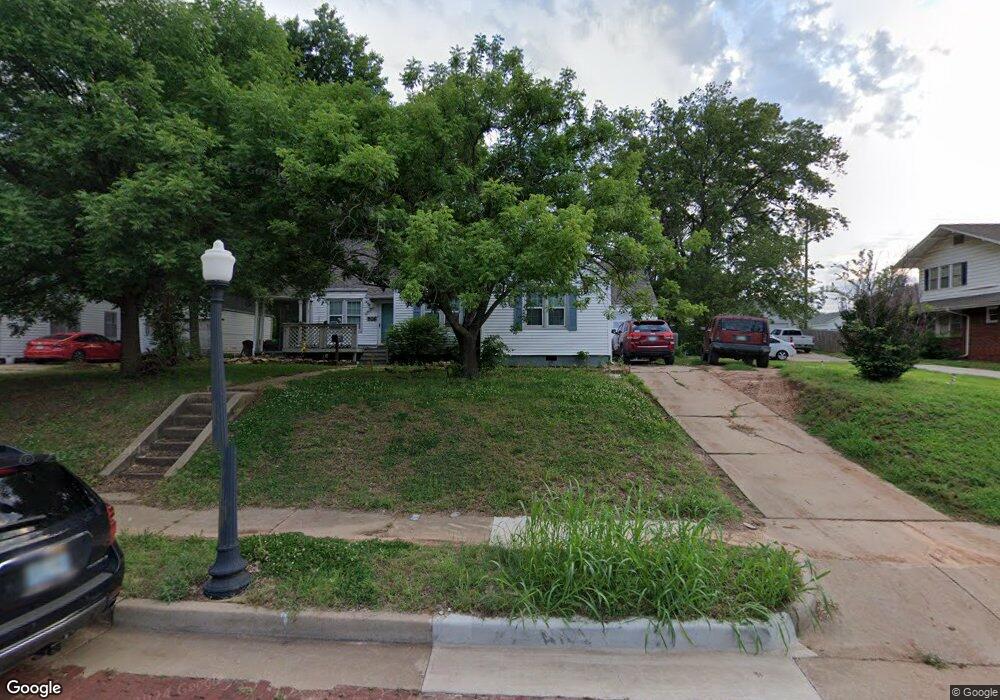
906 S 7th St Ponca City, OK 74601
Estimated Value: $96,000 - $111,364
4
Beds
2
Baths
1,625
Sq Ft
$62/Sq Ft
Est. Value
About This Home
This home is located at 906 S 7th St, Ponca City, OK 74601 and is currently estimated at $101,341, approximately $62 per square foot. 906 S 7th St is a home located in Kay County with nearby schools including Garfield Elementary School, Ponca City East Middle School, and Ponca City West Middle School.
Ownership History
Date
Name
Owned For
Owner Type
Purchase Details
Closed on
May 30, 2019
Sold by
Coutre Sherrie L
Bought by
Lewis Cliff and Lewis Trinity
Current Estimated Value
Home Financials for this Owner
Home Financials are based on the most recent Mortgage that was taken out on this home.
Original Mortgage
$52,000
Outstanding Balance
$45,721
Interest Rate
4.1%
Mortgage Type
Seller Take Back
Estimated Equity
$55,620
Purchase Details
Closed on
Apr 29, 1991
Sold by
Elaine Thomas W and Elaine Eyre
Bought by
Richard Richard M and Richard Coutre S
Create a Home Valuation Report for This Property
The Home Valuation Report is an in-depth analysis detailing your home's value as well as a comparison with similar homes in the area
Home Values in the Area
Average Home Value in this Area
Purchase History
| Date | Buyer | Sale Price | Title Company |
|---|---|---|---|
| Lewis Cliff | $64,000 | Security Title Service | |
| Richard Richard M | $63,500 | -- |
Source: Public Records
Mortgage History
| Date | Status | Borrower | Loan Amount |
|---|---|---|---|
| Open | Lewis Cliff | $52,000 |
Source: Public Records
Tax History Compared to Growth
Tax History
| Year | Tax Paid | Tax Assessment Tax Assessment Total Assessment is a certain percentage of the fair market value that is determined by local assessors to be the total taxable value of land and additions on the property. | Land | Improvement |
|---|---|---|---|---|
| 2024 | $735 | $7,761 | $589 | $7,172 |
| 2023 | $735 | $7,392 | $589 | $6,803 |
| 2022 | $670 | $7,040 | $589 | $6,451 |
| 2021 | $673 | $7,040 | $589 | $6,451 |
| 2020 | $666 | $7,040 | $589 | $6,451 |
| 2019 | $601 | $6,293 | $589 | $5,704 |
| 2018 | $608 | $6,281 | $589 | $5,692 |
| 2017 | $616 | $6,281 | $589 | $5,692 |
| 2016 | $622 | $6,281 | $589 | $5,692 |
| 2015 | $616 | $6,197 | $589 | $5,608 |
| 2014 | $600 | $6,143 | $589 | $5,554 |
Source: Public Records
Map
Nearby Homes