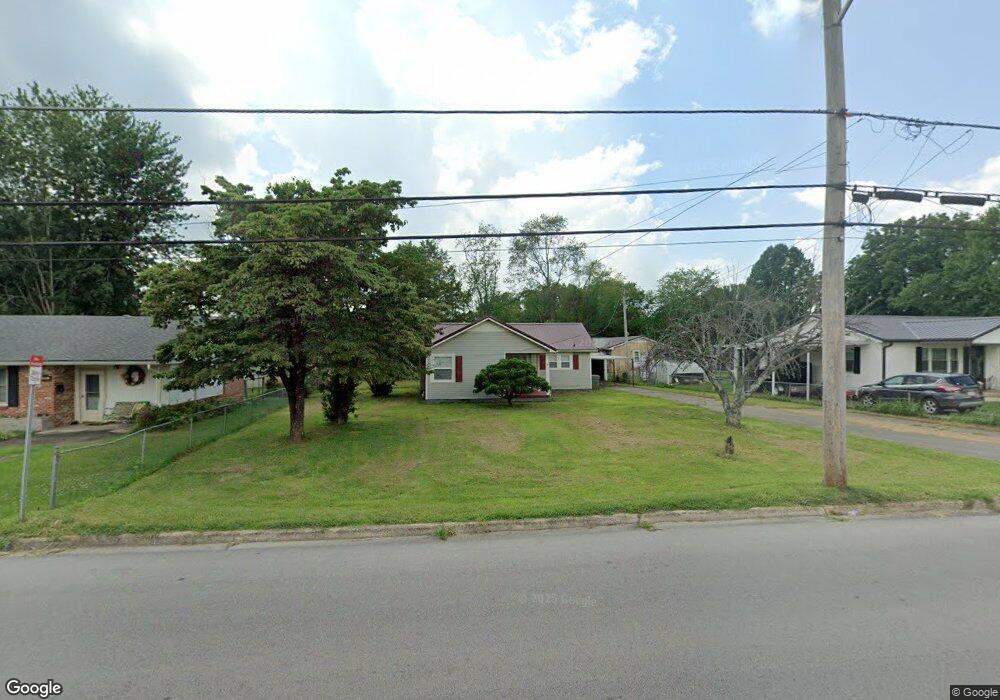
907 Mahr Ave Lawrenceburg, TN 38464
Estimated Value: $146,494 - $187,000
--
Bed
1
Bath
1,030
Sq Ft
$161/Sq Ft
Est. Value
About This Home
This home is located at 907 Mahr Ave, Lawrenceburg, TN 38464 and is currently estimated at $166,124, approximately $161 per square foot. 907 Mahr Ave is a home located in Lawrence County with nearby schools including Ingram Sowell Elementary School, Lawrenceburg Public Elementary School, and David Crockett Elementary School.
Ownership History
Date
Name
Owned For
Owner Type
Purchase Details
Closed on
Jul 21, 2025
Sold by
Hines Sharon and Hines James Ryan
Bought by
Hines James Ryan
Current Estimated Value
Purchase Details
Closed on
Jul 20, 2016
Sold by
Hampton Charles Wade
Bought by
Hines Larry and Hines Sharon
Purchase Details
Closed on
Aug 11, 1993
Bought by
Hampton Charles W and Hampton Doris
Purchase Details
Closed on
Jul 7, 1982
Bought by
Hardwick Dorothy V
Purchase Details
Closed on
Jan 1, 1982
Purchase Details
Closed on
Jan 1, 1981
Purchase Details
Closed on
Jan 1, 1979
Create a Home Valuation Report for This Property
The Home Valuation Report is an in-depth analysis detailing your home's value as well as a comparison with similar homes in the area
Home Values in the Area
Average Home Value in this Area
Purchase History
| Date | Buyer | Sale Price | Title Company |
|---|---|---|---|
| Hines James Ryan | -- | None Listed On Document | |
| Hines James Ryan | -- | None Listed On Document | |
| Hines Larry | $20,000 | -- | |
| Hampton Charles W | $25,500 | -- | |
| Hardwick Dorothy V | -- | -- | |
| -- | $26,500 | -- | |
| -- | $15,000 | -- | |
| -- | $30,000 | -- |
Source: Public Records
Tax History Compared to Growth
Tax History
| Year | Tax Paid | Tax Assessment Tax Assessment Total Assessment is a certain percentage of the fair market value that is determined by local assessors to be the total taxable value of land and additions on the property. | Land | Improvement |
|---|---|---|---|---|
| 2025 | $614 | $19,750 | $0 | $0 |
| 2024 | $614 | $19,750 | $3,125 | $16,625 |
| 2023 | $614 | $19,750 | $3,125 | $16,625 |
| 2022 | $614 | $19,750 | $3,125 | $16,625 |
| 2021 | $508 | $11,575 | $2,500 | $9,075 |
| 2020 | $508 | $11,575 | $2,500 | $9,075 |
| 2019 | $508 | $11,575 | $2,500 | $9,075 |
| 2018 | $508 | $11,575 | $2,500 | $9,075 |
| 2017 | $508 | $11,575 | $2,500 | $9,075 |
| 2016 | $508 | $11,575 | $2,500 | $9,075 |
| 2015 | $482 | $11,575 | $2,500 | $9,075 |
| 2014 | $489 | $11,750 | $2,500 | $9,250 |
Source: Public Records
Map
Nearby Homes