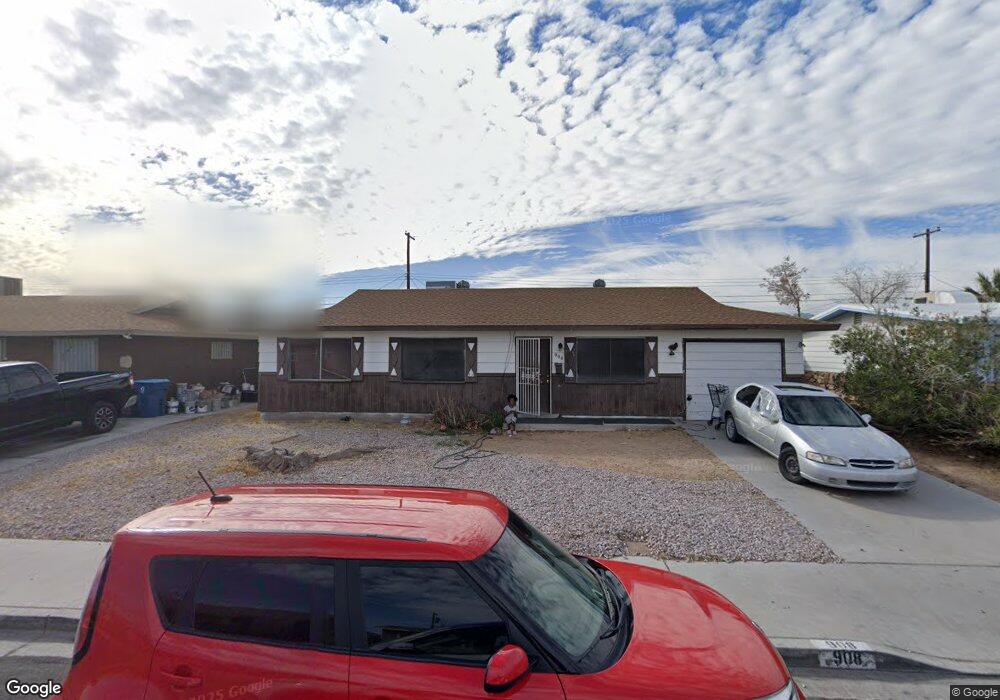
908 Slayton Dr Las Vegas, NV 89107
Charleston Preservation NeighborhoodEstimated Value: $318,000 - $344,000
3
Beds
2
Baths
988
Sq Ft
$334/Sq Ft
Est. Value
About This Home
This home is located at 908 Slayton Dr, Las Vegas, NV 89107 and is currently estimated at $329,588, approximately $333 per square foot. 908 Slayton Dr is a home located in Clark County with nearby schools including Rose Warren Elementary School, Frank F Garside Junior High School, and Bonanza High School.
Ownership History
Date
Name
Owned For
Owner Type
Purchase Details
Closed on
May 29, 2025
Sold by
Desert View Trust and Hales Michael Glade
Bought by
Hales 1988 Trust and Hales
Current Estimated Value
Purchase Details
Closed on
Dec 9, 2019
Sold by
Hales Robert C and Hales Michael G
Bought by
Hales Robert C and Hales Reese
Purchase Details
Closed on
Jun 12, 2006
Sold by
Hales Glade C
Bought by
Hales Robert Cowan and Hales Gaylynn Reese
Purchase Details
Closed on
Nov 22, 2002
Sold by
Hales Glade C and Hales Farres D
Bought by
Hales Glade C
Purchase Details
Closed on
Sep 4, 2001
Sold by
Hales Robert Cowan and Hales Gaylynn Reese
Bought by
Hales Robert Cowan and Hales Gaylynn Reese
Purchase Details
Closed on
Aug 16, 2001
Sold by
Divecchio Anthony and Divecchio Maxine
Bought by
Hales Robert Cowan and Hales Gaylynn Reese
Create a Home Valuation Report for This Property
The Home Valuation Report is an in-depth analysis detailing your home's value as well as a comparison with similar homes in the area
Home Values in the Area
Average Home Value in this Area
Purchase History
| Date | Buyer | Sale Price | Title Company |
|---|---|---|---|
| Hales 1988 Trust | -- | None Listed On Document | |
| Hales Robert C | -- | None Available | |
| Hales Robert Cowan | -- | None Available | |
| Hales Glade C | -- | Equity Title | |
| Hales Glade C | -- | Equity Title | |
| Hales Robert Cowan | $82,000 | Stewart Title | |
| Hales Robert Cowan | $82,000 | Stewart Title |
Source: Public Records
Tax History Compared to Growth
Tax History
| Year | Tax Paid | Tax Assessment Tax Assessment Total Assessment is a certain percentage of the fair market value that is determined by local assessors to be the total taxable value of land and additions on the property. | Land | Improvement |
|---|---|---|---|---|
| 2025 | $639 | $46,552 | $31,500 | $15,052 |
| 2024 | $621 | $46,552 | $31,500 | $15,052 |
| 2023 | $651 | $42,695 | $29,050 | $13,645 |
| 2022 | $632 | $35,957 | $23,800 | $12,157 |
| 2021 | $585 | $32,673 | $21,350 | $11,323 |
| 2020 | $586 | $33,045 | $22,050 | $10,995 |
| 2019 | $549 | $26,701 | $16,100 | $10,601 |
| 2018 | $524 | $23,979 | $14,000 | $9,979 |
| 2017 | $726 | $22,136 | $12,250 | $9,886 |
| 2016 | $497 | $19,017 | $9,450 | $9,567 |
| 2015 | $496 | $16,280 | $7,000 | $9,280 |
| 2014 | $481 | $14,224 | $5,250 | $8,974 |
Source: Public Records
Map
Nearby Homes
- 6120 Cairo Cir
- 6232 Blair Way
- 6316 Casada Way
- 6318 Casada Way
- 6320 Casada Way
- 6204 W Charleston Blvd
- 6340 Casada Way
- 6100 Alamo Cir
- 6344 Evergreen Ave
- 5900 Concert Dr
- 6325 Burgundy Way
- 6412 Bristol Way
- 6420 Evergreen Ave
- 6432 Bannock Way
- 6409 Burgundy Way
- 6225 Arlington Ave
- 6444 Bannock Way
- 809 Upland Blvd
- 6224 Arlington Ave
- 6229 Cromwell Ave