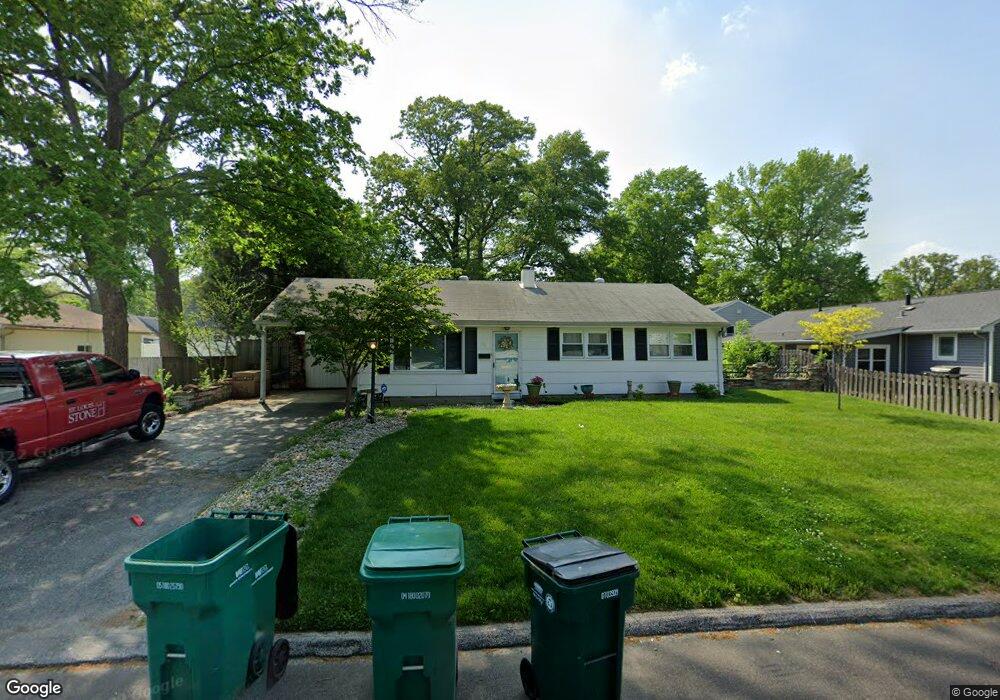
909 Colebrook Dr Saint Louis, MO 63119
Estimated Value: $329,000 - $366,000
3
Beds
1
Bath
1,634
Sq Ft
$212/Sq Ft
Est. Value
About This Home
This home is located at 909 Colebrook Dr, Saint Louis, MO 63119 and is currently estimated at $346,851, approximately $212 per square foot. 909 Colebrook Dr is a home located in St. Louis County with nearby schools including Edgar Road Elementary School, Hixson Middle School, and Webster Groves High School.
Ownership History
Date
Name
Owned For
Owner Type
Purchase Details
Closed on
May 27, 2011
Sold by
Kennedy Theresa Marie and Kennedy Timothy Mark
Bought by
Goodman Karen Sue
Current Estimated Value
Home Financials for this Owner
Home Financials are based on the most recent Mortgage that was taken out on this home.
Original Mortgage
$136,451
Outstanding Balance
$94,257
Interest Rate
4.75%
Mortgage Type
FHA
Estimated Equity
$252,594
Purchase Details
Closed on
Sep 19, 2002
Sold by
Rhodes Sharon J
Bought by
Kennedy Catherine J
Purchase Details
Closed on
Jun 26, 2001
Sold by
Miller Violet Jeane
Bought by
Rhodes Sharon J
Home Financials for this Owner
Home Financials are based on the most recent Mortgage that was taken out on this home.
Original Mortgage
$100,000
Interest Rate
7.11%
Purchase Details
Closed on
Oct 27, 1999
Sold by
Jeane Sullivan and Jeane Miller
Bought by
Miller Violet Jeane
Create a Home Valuation Report for This Property
The Home Valuation Report is an in-depth analysis detailing your home's value as well as a comparison with similar homes in the area
Home Values in the Area
Average Home Value in this Area
Purchase History
| Date | Buyer | Sale Price | Title Company |
|---|---|---|---|
| Goodman Karen Sue | $140,000 | Atc | |
| Kennedy Catherine J | $138,000 | -- | |
| Rhodes Sharon J | $125,000 | -- | |
| Miller Violet Jeane | -- | -- |
Source: Public Records
Mortgage History
| Date | Status | Borrower | Loan Amount |
|---|---|---|---|
| Open | Goodman Karen Sue | $136,451 | |
| Previous Owner | Rhodes Sharon J | $100,000 |
Source: Public Records
Tax History Compared to Growth
Tax History
| Year | Tax Paid | Tax Assessment Tax Assessment Total Assessment is a certain percentage of the fair market value that is determined by local assessors to be the total taxable value of land and additions on the property. | Land | Improvement |
|---|---|---|---|---|
| 2025 | $3,585 | $57,810 | $30,890 | $26,920 |
| 2024 | $3,585 | $51,380 | $24,680 | $26,700 |
| 2023 | $3,567 | $51,380 | $24,680 | $26,700 |
| 2022 | $3,168 | $42,290 | $21,620 | $20,670 |
| 2021 | $3,157 | $42,290 | $21,620 | $20,670 |
| 2020 | $3,385 | $42,280 | $24,700 | $17,580 |
| 2019 | $3,366 | $42,280 | $24,700 | $17,580 |
| 2018 | $2,969 | $33,060 | $15,430 | $17,630 |
| 2017 | $2,949 | $33,060 | $15,430 | $17,630 |
| 2016 | $2,328 | $24,910 | $10,790 | $14,120 |
| 2015 | $2,327 | $24,910 | $10,790 | $14,120 |
| 2014 | $3,133 | $32,730 | $9,630 | $23,100 |
Source: Public Records
Map
Nearby Homes
- 107 Saint George Place
- 308 Oak Tree Dr
- 312 Oak Tree Dr
- 12 Webster Acres
- 26 Webster Oaks Dr
- 30 Webster Oaks Dr
- 725 Brookridge Dr
- 1330 Drayton Ave
- 714 Brookridge Dr
- 907 Edgar Rd
- 134 Firwood Dr
- 147 Firwood Dr
- 50 Chestnut Hill Ln
- 514 S Gore Ave
- 125 E Frisco Ave
- 426 S Maple Ave
- 203 E Jackson Rd
- 1509 Holly Dr
- 8261 Watson Rd
- 432 Reavis Place Unit 20
- 142 E Glendale Rd
- 136 E Glendale Rd
- 961 Colebrook Dr
- 917 Colebrook Dr
- 132 E Glendale Rd
- 139 Oak Tree Dr
- 200 E Glendale Rd
- 128 E Glendale Rd
- 203 Oak Tree Dr
- 131 Oak Tree Dr
- 208 E Glendale Rd
- 828 Colebrook Dr
- 124 E Glendale Rd
- 127 Oak Tree Dr
- 209 Oak Tree Dr
- 829 Colebrook Dr
- 824 Colebrook Dr
- 853 Pine Tree Ln
- 214 E Glendale Rd
- 123 Oak Tree Dr