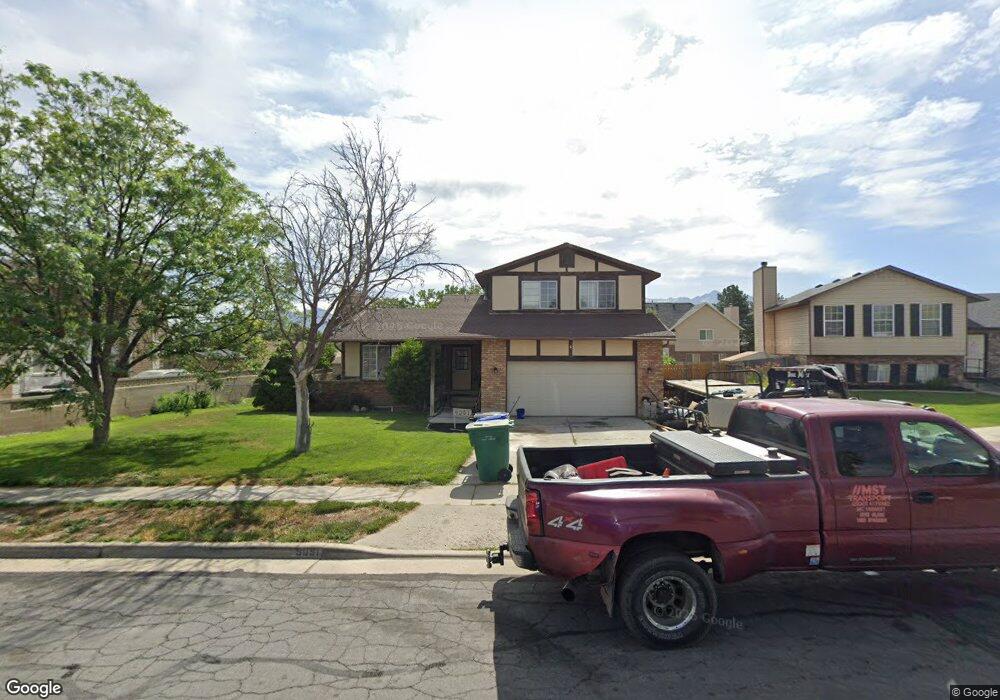
9091 S Wimbleton Place West Jordan, UT 84088
Edenbrooke NeighborhoodEstimated Value: $547,000 - $657,000
5
Beds
3
Baths
2,744
Sq Ft
$214/Sq Ft
Est. Value
About This Home
This home is located at 9091 S Wimbleton Place, West Jordan, UT 84088 and is currently estimated at $587,217, approximately $214 per square foot. 9091 S Wimbleton Place is a home located in Salt Lake County with nearby schools including Westvale Elementary School, Joel P. Jensen Middle School, and West Jordan High School.
Ownership History
Date
Name
Owned For
Owner Type
Purchase Details
Closed on
Dec 14, 2016
Sold by
Lindsey Angela and Sumner Tammy
Bought by
Sumner Tammy and Neal Timothy Randall
Current Estimated Value
Purchase Details
Closed on
Nov 5, 2014
Sold by
Neal Randall Frank and Bailey Angela
Bought by
Sumner Tammy
Purchase Details
Closed on
Jul 13, 2005
Sold by
Neal Tim Randall
Bought by
Neal Randall Frank
Purchase Details
Closed on
Jan 13, 2005
Sold by
Neal Tim Randall
Bought by
Neal Tim Randall and Bailey Angela
Home Financials for this Owner
Home Financials are based on the most recent Mortgage that was taken out on this home.
Original Mortgage
$140,000
Interest Rate
8.35%
Mortgage Type
Purchase Money Mortgage
Purchase Details
Closed on
Jan 7, 2005
Sold by
Greenwood Larry Wayne and Greenwood Phyllis K
Bought by
Neal Tim
Home Financials for this Owner
Home Financials are based on the most recent Mortgage that was taken out on this home.
Original Mortgage
$140,000
Interest Rate
8.35%
Mortgage Type
Purchase Money Mortgage
Create a Home Valuation Report for This Property
The Home Valuation Report is an in-depth analysis detailing your home's value as well as a comparison with similar homes in the area
Home Values in the Area
Average Home Value in this Area
Purchase History
| Date | Buyer | Sale Price | Title Company |
|---|---|---|---|
| Sumner Tammy | -- | None Available | |
| Sumner Tammy | -- | None Available | |
| Neal Randall Frank | -- | -- | |
| Neal Tim Randall | -- | Integrated Title Ins Svcs | |
| Neal Tim | -- | Integrated Title Ins Svcs |
Source: Public Records
Mortgage History
| Date | Status | Borrower | Loan Amount |
|---|---|---|---|
| Previous Owner | Neal Tim | $140,000 |
Source: Public Records
Tax History Compared to Growth
Tax History
| Year | Tax Paid | Tax Assessment Tax Assessment Total Assessment is a certain percentage of the fair market value that is determined by local assessors to be the total taxable value of land and additions on the property. | Land | Improvement |
|---|---|---|---|---|
| 2025 | $2,600 | $515,800 | $155,900 | $359,900 |
| 2024 | $2,600 | $500,200 | $150,900 | $349,300 |
| 2023 | $2,586 | $468,900 | $147,900 | $321,000 |
| 2022 | $2,689 | $479,700 | $145,000 | $334,700 |
| 2021 | $2,275 | $369,400 | $106,000 | $263,400 |
| 2020 | $2,141 | $326,300 | $96,000 | $230,300 |
| 2019 | $2,163 | $323,200 | $96,000 | $227,200 |
| 2018 | $1,956 | $289,900 | $92,600 | $197,300 |
| 2017 | $1,825 | $269,300 | $92,600 | $176,700 |
| 2016 | $1,794 | $248,700 | $92,600 | $156,100 |
| 2015 | $1,678 | $226,900 | $99,700 | $127,200 |
| 2014 | $1,602 | $213,200 | $95,300 | $117,900 |
Source: Public Records
Map
Nearby Homes
- 2883 Jana Lee Dr
- 2970 W 8870 S
- 3214 W Monterey Pine Ln
- 8886 S 2700 W
- 2636 W 9110 S
- 9294 S 2700 W
- 1967 W 9350 S
- 9178 Lisa Ave
- 3256 Star Fire Rd
- 4000 W 8400 S Unit 83
- 2286 Williamsburg Cir
- 8493 S 3200 W
- 9441 S Newkirk St
- 9526 Ember Glow Ct Unit C
- 2223 W Williamsburg Cir
- 3750 W Bingham Creek Dr
- 9566 Ember Glow Ct Unit C
- 3702 W Angus Dr
- 3112 Green Acre Dr
- 2177 W 9240 S
- 9091 Wimbleton Place
- 9077 S Wimbleton Place
- 9105 S Wimbleton Place
- 9105 Wimbleton Place
- 9077 Wimbleton Place
- 9086 S Edenbrook Way
- 9086 Edenbrook Way
- 9098 Edenbrook Way
- 9074 S Edenbrook Way
- 9074 Edenbrook Way
- 9090 Wimbleton Place
- 9109 S Wimbleton Place
- 3021 W 9050 S
- 9109 Wimbleton Place
- 9076 S Wimbleton Place
- 9076 Wimbleton Place
- 9104 Wimbleton Place
- 9112 Edenbrook Way
- 9062 S Edenbrook Way
- 9062 Edenbrook Way