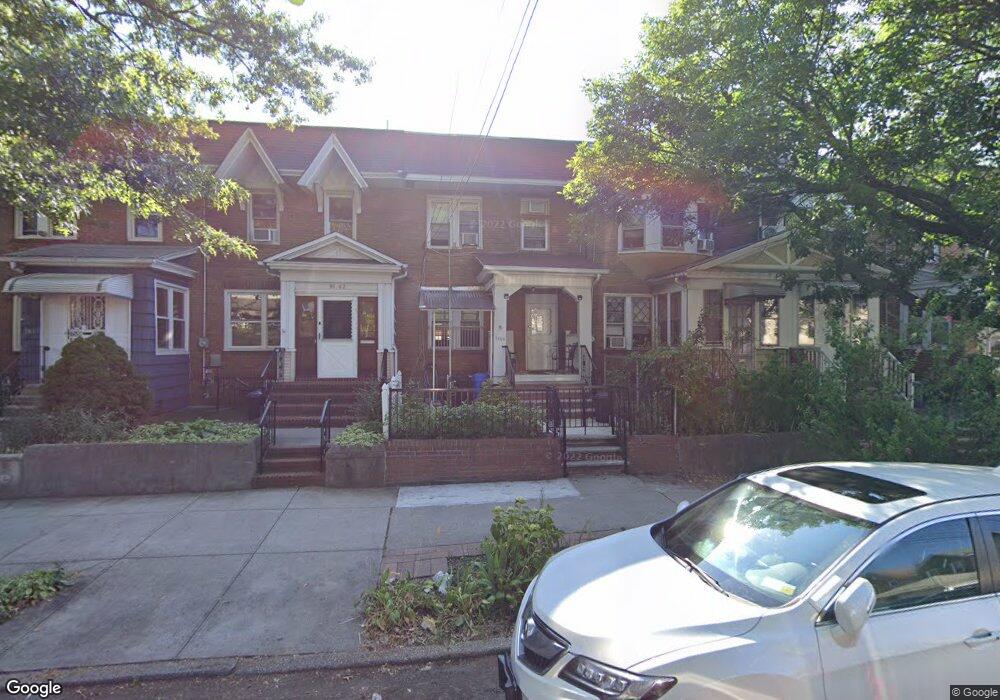
91-60 96th St Woodhaven, NY 11421
Woodhaven NeighborhoodEstimated Value: $687,000 - $766,000
4
Beds
2
Baths
1,268
Sq Ft
$569/Sq Ft
Est. Value
About This Home
This home is located at 91-60 96th St, Woodhaven, NY 11421 and is currently estimated at $721,365, approximately $568 per square foot. 91-60 96th St is a home located in Queens County with nearby schools including P.S. 273, Jhs 210 Elizabeth Blackwell, and Richmond Hill High School.
Ownership History
Date
Name
Owned For
Owner Type
Purchase Details
Closed on
Jun 15, 2022
Sold by
Liang Mei Qing and Zhu En Pu
Bought by
Liang Mei Qing
Current Estimated Value
Purchase Details
Closed on
Mar 4, 2016
Sold by
Kudyan Vera
Bought by
Liang Mei Qing and Zhu En Pu
Home Financials for this Owner
Home Financials are based on the most recent Mortgage that was taken out on this home.
Original Mortgage
$160,000
Outstanding Balance
$126,933
Interest Rate
3.72%
Mortgage Type
Purchase Money Mortgage
Estimated Equity
$594,432
Create a Home Valuation Report for This Property
The Home Valuation Report is an in-depth analysis detailing your home's value as well as a comparison with similar homes in the area
Home Values in the Area
Average Home Value in this Area
Purchase History
| Date | Buyer | Sale Price | Title Company |
|---|---|---|---|
| Liang Mei Qing | -- | -- | |
| Liang Mei Qing | $488,000 | -- |
Source: Public Records
Mortgage History
| Date | Status | Borrower | Loan Amount |
|---|---|---|---|
| Open | Liang Mei Qing | $160,000 |
Source: Public Records
Tax History Compared to Growth
Tax History
| Year | Tax Paid | Tax Assessment Tax Assessment Total Assessment is a certain percentage of the fair market value that is determined by local assessors to be the total taxable value of land and additions on the property. | Land | Improvement |
|---|---|---|---|---|
| 2025 | $5,597 | $29,539 | $7,590 | $21,949 |
| 2024 | $5,597 | $27,868 | $8,461 | $19,407 |
| 2023 | $5,471 | $27,238 | $8,269 | $18,969 |
| 2022 | $2,565 | $39,720 | $11,640 | $28,080 |
| 2021 | $2,704 | $34,380 | $11,640 | $22,740 |
| 2020 | $2,605 | $33,720 | $11,640 | $22,080 |
| 2019 | $2,429 | $34,560 | $11,640 | $22,920 |
| 2018 | $4,748 | $22,698 | $8,807 | $13,891 |
| 2016 | $3,971 | $21,414 | $9,252 | $12,162 |
| 2015 | $2,217 | $20,514 | $10,917 | $9,597 |
| 2014 | $2,217 | $19,353 | $10,561 | $8,792 |
Source: Public Records
Map
Nearby Homes