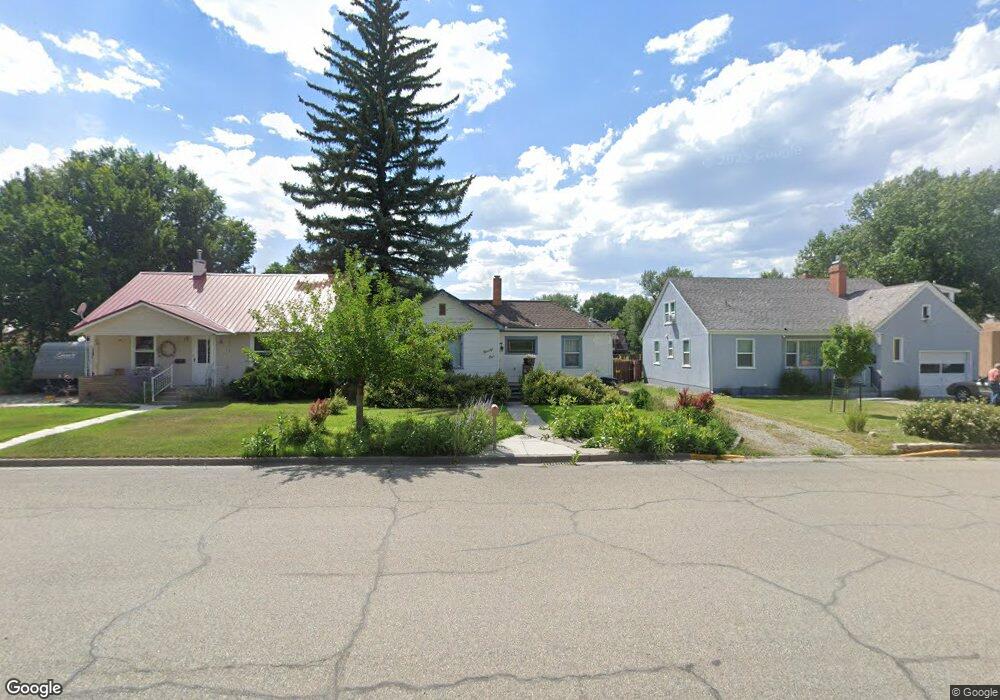
91 San Juan Ave Alamosa, CO 81101
Estimated Value: $193,000 - $211,000
3
Beds
1
Bath
850
Sq Ft
$239/Sq Ft
Est. Value
About This Home
This home is located at 91 San Juan Ave, Alamosa, CO 81101 and is currently estimated at $202,889, approximately $238 per square foot. 91 San Juan Ave is a home located in Alamosa County with nearby schools including Alamosa Elementary School, Ortega Middle School, and Alamosa High School.
Ownership History
Date
Name
Owned For
Owner Type
Purchase Details
Closed on
Apr 18, 2011
Sold by
Dixon Hobart N and Dixon Ruth A
Bought by
Dixon Hobart N and Dixonq Ruth A
Current Estimated Value
Purchase Details
Closed on
Aug 31, 2001
Sold by
Mortensen Craig H and Mortensen Marjorie A
Bought by
Dixon Hobart N and Dixon Ruth A
Purchase Details
Closed on
Aug 20, 1998
Sold by
Campbell Marshall Scott and Campbell Natalie Marie
Bought by
Mortensen Craig H and Mortensen Marjorie A
Purchase Details
Closed on
Oct 31, 1996
Sold by
Gile Joseph E and Gile Anne M
Bought by
Campbell Marshall Scott and Campbell Natalie Marie
Purchase Details
Closed on
Aug 3, 1995
Sold by
Kelly Martha A
Bought by
Gile Joseph E and Gile Anne M
Purchase Details
Closed on
Jul 29, 1991
Sold by
Martin Konnie
Bought by
Kelly Martha
Purchase Details
Closed on
Nov 24, 1987
Sold by
Bohn Kristi Lee
Bought by
Martin Konnie
Purchase Details
Closed on
Sep 1, 1976
Sold by
Gilmore Dewey
Bought by
Bohn Kristi Lee
Create a Home Valuation Report for This Property
The Home Valuation Report is an in-depth analysis detailing your home's value as well as a comparison with similar homes in the area
Home Values in the Area
Average Home Value in this Area
Purchase History
| Date | Buyer | Sale Price | Title Company |
|---|---|---|---|
| Dixon Hobart N | -- | None Available | |
| Dixon Hobart N | $71,000 | -- | |
| Mortensen Craig H | $67,000 | -- | |
| Campbell Marshall Scott | $63,400 | -- | |
| Gile Joseph E | $49,600 | -- | |
| Kelly Martha | $37,500 | -- | |
| Martin Konnie | $29,100 | -- | |
| Bohn Kristi Lee | $20,300 | -- |
Source: Public Records
Tax History Compared to Growth
Tax History
| Year | Tax Paid | Tax Assessment Tax Assessment Total Assessment is a certain percentage of the fair market value that is determined by local assessors to be the total taxable value of land and additions on the property. | Land | Improvement |
|---|---|---|---|---|
| 2024 | $537 | $10,945 | $1,206 | $9,739 |
| 2023 | $550 | $11,051 | $1,218 | $9,833 |
| 2022 | $598 | $7,775 | $858 | $6,917 |
| 2021 | $615 | $7,775 | $858 | $6,917 |
| 2020 | $600 | $7,775 | $858 | $6,917 |
| 2019 | $602 | $7,455 | $858 | $6,597 |
| 2018 | $540 | $6,566 | $864 | $5,702 |
| 2017 | $562 | $6,825 | $864 | $5,961 |
| 2016 | $624 | $7,615 | $955 | $6,660 |
| 2015 | $623 | $7,615 | $955 | $6,660 |
| 2014 | -- | $7,615 | $955 | $6,660 |
| 2013 | -- | $7,615 | $955 | $6,660 |
Source: Public Records
Map
Nearby Homes
- 735 First St
- 631 2nd St
- 0 Mountain View Blvd Unit 23881373
- 6 Mountain View Place
- Lot 14 Fourth St
- 24 Alamosa Ave
- 6 Bellwood Dr
- 302 Bell Ave
- 0 U S 160
- 1623-B 6th St
- 400 & 406 6th St
- 531 Alamosa Ave
- 61 Conejos Ave
- 125 Lots Cottonwoods Phase II
- 1374 N Co Road 110
- 119 Poncha Ave
- 12 Rio Grande Ave
- 82 Monterey Ave
- 1002 Edison Ave
- 1330 W 7th St