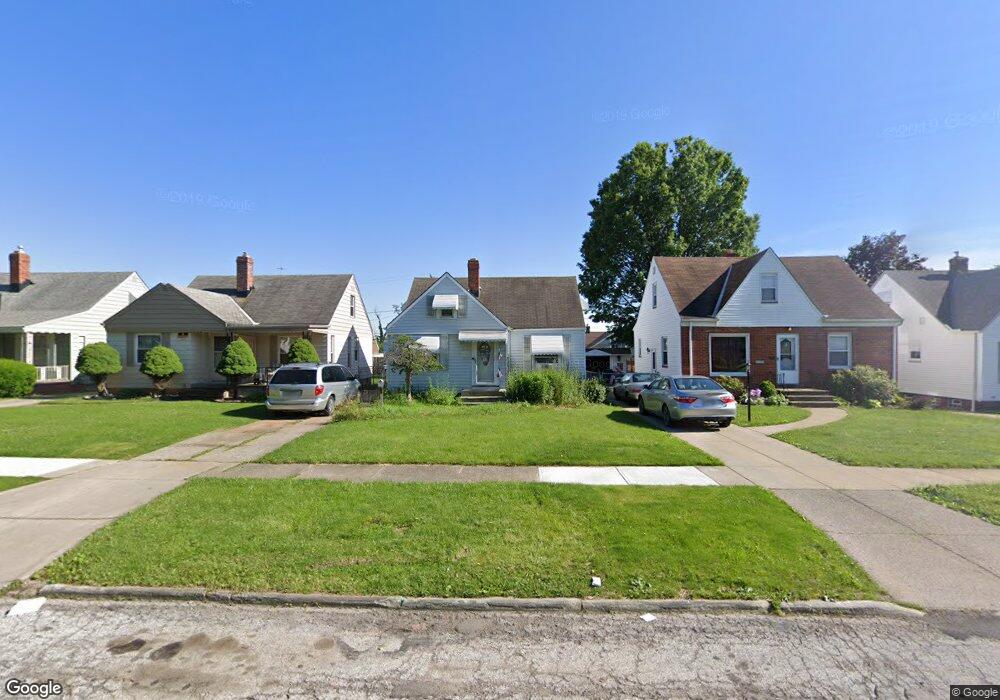
9106 Mccracken Blvd Cleveland, OH 44125
Estimated Value: $108,384 - $147,000
2
Beds
1
Bath
1,008
Sq Ft
$125/Sq Ft
Est. Value
About This Home
This home is located at 9106 Mccracken Blvd, Cleveland, OH 44125 and is currently estimated at $125,596, approximately $124 per square foot. 9106 Mccracken Blvd is a home located in Cuyahoga County with nearby schools including Garfield Heights High School, North Shore High School, and Trinity High School.
Ownership History
Date
Name
Owned For
Owner Type
Purchase Details
Closed on
Aug 25, 2005
Sold by
Saliga Richard R and Saliga Kimberly D
Bought by
Lockwood Timothy G
Current Estimated Value
Home Financials for this Owner
Home Financials are based on the most recent Mortgage that was taken out on this home.
Original Mortgage
$79,600
Outstanding Balance
$42,452
Interest Rate
5.8%
Mortgage Type
FHA
Estimated Equity
$83,144
Purchase Details
Closed on
Mar 28, 1991
Sold by
Parker Cheryl L
Bought by
Saliga Richard R
Purchase Details
Closed on
Jun 7, 1990
Sold by
Hankey William J
Bought by
Parker Cheryl L
Purchase Details
Closed on
Jul 16, 1986
Sold by
Saber Frank M
Bought by
Hankey William J
Purchase Details
Closed on
Sep 19, 1979
Sold by
Saber Anna
Bought by
Saber Frank M
Purchase Details
Closed on
Jul 20, 1979
Sold by
Saber Mike and Saber Anna
Bought by
Saber Anna
Purchase Details
Closed on
Jan 1, 1975
Bought by
Saber Mike and Saber Anna
Create a Home Valuation Report for This Property
The Home Valuation Report is an in-depth analysis detailing your home's value as well as a comparison with similar homes in the area
Home Values in the Area
Average Home Value in this Area
Purchase History
| Date | Buyer | Sale Price | Title Company |
|---|---|---|---|
| Lockwood Timothy G | $95,000 | Executive Title Agency | |
| Saliga Richard R | $60,000 | -- | |
| Parker Cheryl L | -- | -- | |
| Hankey William J | $49,500 | -- | |
| Saber Frank M | -- | -- | |
| Saber Anna | -- | -- | |
| Saber Mike | -- | -- |
Source: Public Records
Mortgage History
| Date | Status | Borrower | Loan Amount |
|---|---|---|---|
| Open | Lockwood Timothy G | $79,600 |
Source: Public Records
Tax History Compared to Growth
Tax History
| Year | Tax Paid | Tax Assessment Tax Assessment Total Assessment is a certain percentage of the fair market value that is determined by local assessors to be the total taxable value of land and additions on the property. | Land | Improvement |
|---|---|---|---|---|
| 2024 | $3,422 | $33,005 | $7,840 | $25,165 |
| 2023 | $2,807 | $25,030 | $5,740 | $19,290 |
| 2022 | $2,766 | $25,030 | $5,740 | $19,290 |
| 2021 | $2,922 | $25,030 | $5,740 | $19,290 |
| 2020 | $2,515 | $20,020 | $4,590 | $15,440 |
| 2019 | $2,492 | $57,200 | $13,100 | $44,100 |
| 2018 | $2,592 | $20,020 | $4,590 | $15,440 |
| 2017 | $2,507 | $18,900 | $3,640 | $15,260 |
| 2016 | $2,543 | $18,900 | $3,640 | $15,260 |
| 2015 | $2,796 | $18,900 | $3,640 | $15,260 |
| 2014 | $2,796 | $23,040 | $4,450 | $18,590 |
Source: Public Records
Map
Nearby Homes
- 8827 Park Heights Ave
- 9011 Park Heights Ave
- 9302 Park Heights Ave
- 8531 Cherie Dr
- 4969 E 90th St
- 4963 E 88th St
- 9611 Mccracken Rd
- 9612 Park Heights Ave
- 4932 E 93rd St
- 4915 E 88th St
- 5074 Donovan Dr
- 4909 E 85th St
- 9513 David Rd
- 4903 E 94th St
- 4888 E 85th St
- 9819 S Highland Ave
- 10005 Park Heights Ave
- 4839 E 94th St
- 10016 Park Heights Ave
- 4899 E 96th St
- 9202 Mccracken Blvd
- 9102 Mccracken Blvd
- 9206 Mccracken Blvd
- 9010 Mccracken Blvd
- 9210 Mccracken Blvd
- 9006 Mccracken Blvd
- 9107 S Highland Ave
- 9203 S Highland Ave
- 9103 S Highland Ave
- 9207 S Highland Ave
- 9011 S Highland Ave
- 9302 Mccracken Blvd
- 9002 Mccracken Blvd
- 9211 S Highland Ave
- 9007 S Highland Ave
- 9107 Mccracken Blvd
- 9203 Mccracken Blvd
- 9011 Mccracken Blvd
- 9306 Mccracken Blvd
- 8914 Mccracken Blvd