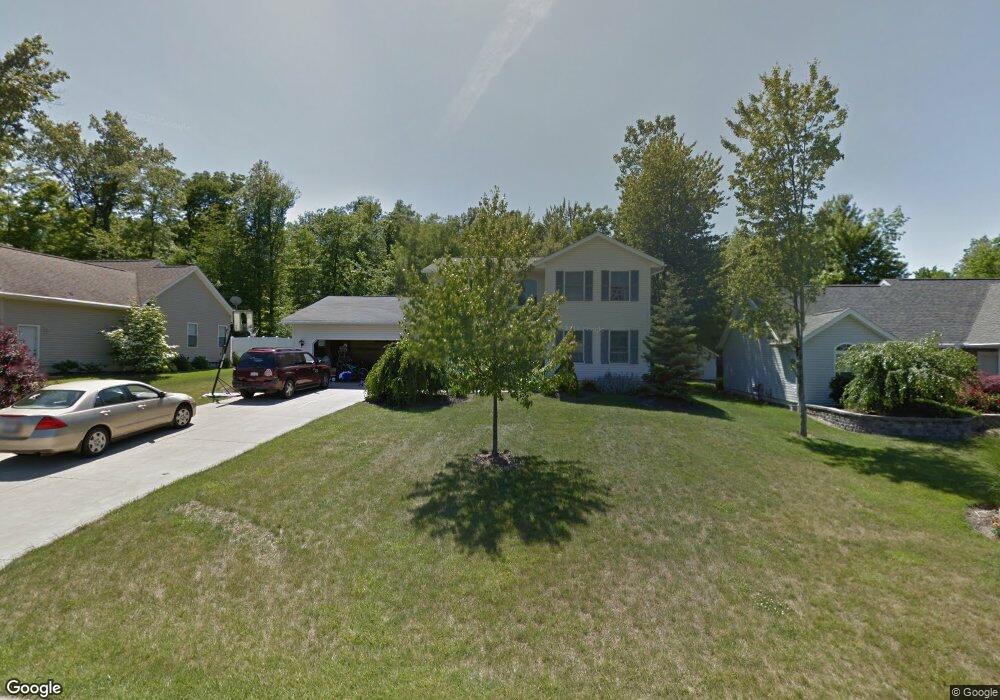
911 Randallwood Dr Ontario, OH 44906
Estimated Value: $281,313 - $319,000
3
Beds
3
Baths
2,112
Sq Ft
$141/Sq Ft
Est. Value
About This Home
This home is located at 911 Randallwood Dr, Ontario, OH 44906 and is currently estimated at $297,328, approximately $140 per square foot. 911 Randallwood Dr is a home located in Richland County with nearby schools including Stingel Elementary School, Ontario Middle School, and Ontario High School.
Ownership History
Date
Name
Owned For
Owner Type
Purchase Details
Closed on
Jul 8, 2011
Sold by
Crum Harry E
Bought by
Crum Harry E and Crum Tracy A
Current Estimated Value
Purchase Details
Closed on
Oct 17, 2005
Sold by
Hazlett Heath and Hazlett Lena
Bought by
Crum Harry E
Home Financials for this Owner
Home Financials are based on the most recent Mortgage that was taken out on this home.
Original Mortgage
$189,900
Outstanding Balance
$102,027
Interest Rate
5.82%
Mortgage Type
Fannie Mae Freddie Mac
Estimated Equity
$195,301
Purchase Details
Closed on
Jul 23, 2001
Sold by
Stander Richard R
Bought by
Hazlett Heath and Hazlett Lena
Home Financials for this Owner
Home Financials are based on the most recent Mortgage that was taken out on this home.
Original Mortgage
$16,200
Interest Rate
7.22%
Mortgage Type
New Conventional
Create a Home Valuation Report for This Property
The Home Valuation Report is an in-depth analysis detailing your home's value as well as a comparison with similar homes in the area
Home Values in the Area
Average Home Value in this Area
Purchase History
| Date | Buyer | Sale Price | Title Company |
|---|---|---|---|
| Crum Harry E | -- | Republic Title Agency Inc | |
| Crum Harry E | $189,900 | Ltic | |
| Hazlett Heath | $18,000 | -- |
Source: Public Records
Mortgage History
| Date | Status | Borrower | Loan Amount |
|---|---|---|---|
| Open | Crum Harry E | $189,900 | |
| Previous Owner | Hazlett Heath | $16,200 |
Source: Public Records
Tax History Compared to Growth
Tax History
| Year | Tax Paid | Tax Assessment Tax Assessment Total Assessment is a certain percentage of the fair market value that is determined by local assessors to be the total taxable value of land and additions on the property. | Land | Improvement |
|---|---|---|---|---|
| 2024 | $3,678 | $73,810 | $5,620 | $68,190 |
| 2023 | $3,678 | $73,810 | $5,620 | $68,190 |
| 2022 | $3,490 | $60,260 | $5,150 | $55,110 |
| 2021 | $3,496 | $60,260 | $5,150 | $55,110 |
| 2020 | $3,732 | $60,260 | $5,150 | $55,110 |
| 2019 | $3,494 | $51,060 | $4,360 | $46,700 |
| 2018 | $2,966 | $51,060 | $4,360 | $46,700 |
| 2017 | $2,919 | $51,060 | $4,360 | $46,700 |
| 2016 | $3,067 | $53,320 | $4,240 | $49,080 |
| 2015 | $3,064 | $53,320 | $4,240 | $49,080 |
| 2014 | $3,069 | $53,320 | $4,240 | $49,080 |
| 2012 | $1,438 | $54,960 | $4,360 | $50,600 |
Source: Public Records
Map
Nearby Homes
- 1947 Teakwood Dr
- 2007 Teakwood Dr
- 2010 Teakwood Dr
- 1915 Teakwood Dr Unit 1915
- 1909 Teakwood Dr
- 648 Villa Dr Unit 648
- 2270 Ferguson Rd
- 700 Villa Dr
- 720 Lindaire Ln E
- 655 Villa Dr
- 1980 Walker Lake Rd
- 0 Spring Village Ln
- 1396 Spring Village Dr Unit 1398
- Lot 2 Spring Village Ln
- 1598-1600 Spring Village Ln
- 1496 W 4th St
- 1592 Walker Woods Blvd
- 2585 Deerfield Ln
- 1996 Park Ave W
- 2583 Deerfield Ln
- 917 Randallwood Dr
- 912 Randallwood Dr
- 918 Randallwood Dr
- 906 Randallwood Dr
- 895 Randallwood Dr
- 895 Randallwood Dr
- 1956 Teakwood Dr
- 1982 Teakwood Dr
- 1960 Teakwood Dr
- 2009 Teakwood Dr
- 880 Randallwood Dr
- 1954 Rosewood Dr
- 1956 Willowood Dr N
- 1960 Rosewood Dr
- 1994 Teakwood Dr
- 1941 Teakwood Dr
- 1960 Willowood Dr N
- 1966 Willowood Dr N
- 1942 Rosewood Dr
- 1950 Teakwood Dr