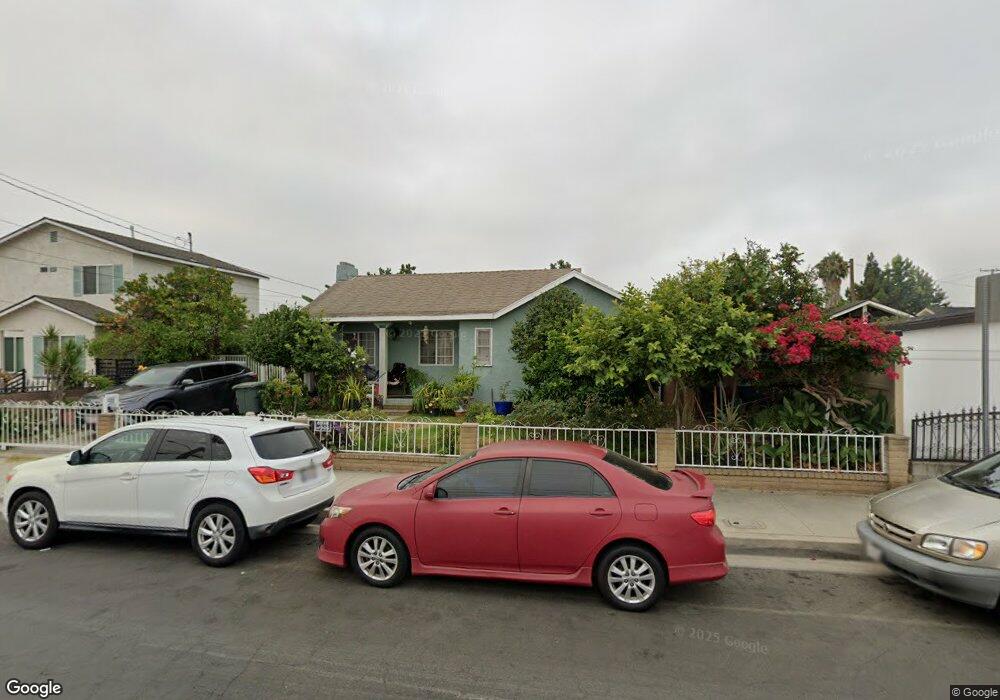
9112 Ramona St Bellflower, CA 90706
Estimated Value: $817,307 - $919,000
3
Beds
2
Baths
1,393
Sq Ft
$621/Sq Ft
Est. Value
About This Home
This home is located at 9112 Ramona St, Bellflower, CA 90706 and is currently estimated at $865,577, approximately $621 per square foot. 9112 Ramona St is a home located in Los Angeles County with nearby schools including Mayfair High School and St. Bernard School.
Ownership History
Date
Name
Owned For
Owner Type
Purchase Details
Closed on
Jul 1, 2013
Sold by
Gonzalez Carlos
Bought by
Gonzalez Mirna D Acosta
Current Estimated Value
Purchase Details
Closed on
Jun 27, 2013
Sold by
Gonzalez Mirna D Acosta
Bought by
Gonzalez Mirna D Acosta
Purchase Details
Closed on
Mar 27, 2008
Sold by
Acosta Carlos
Bought by
Acosta Mirna D
Purchase Details
Closed on
Nov 7, 2001
Sold by
Lopez Dolores Isabel and Acosta Mirna Dinora
Bought by
Acosta Mirna Dinora
Home Financials for this Owner
Home Financials are based on the most recent Mortgage that was taken out on this home.
Original Mortgage
$148,900
Interest Rate
6.39%
Purchase Details
Closed on
Feb 15, 1994
Sold by
Schempf April L
Bought by
Lopez Dolores Isabel
Create a Home Valuation Report for This Property
The Home Valuation Report is an in-depth analysis detailing your home's value as well as a comparison with similar homes in the area
Home Values in the Area
Average Home Value in this Area
Purchase History
| Date | Buyer | Sale Price | Title Company |
|---|---|---|---|
| Gonzalez Mirna D Acosta | -- | Provident Title Company | |
| Lopez Dolores Isabel | -- | Provident Title Company | |
| Gonzalez Mirna D Acosta | -- | Provident Title Company | |
| Acosta Mirna D | -- | None Available | |
| Acosta Mirna Dinora | -- | Gateway Title | |
| Lopez Dolores Isabel | -- | Orange Coast Title |
Source: Public Records
Mortgage History
| Date | Status | Borrower | Loan Amount |
|---|---|---|---|
| Previous Owner | Acosta Mirna Dinora | $148,900 |
Source: Public Records
Tax History Compared to Growth
Tax History
| Year | Tax Paid | Tax Assessment Tax Assessment Total Assessment is a certain percentage of the fair market value that is determined by local assessors to be the total taxable value of land and additions on the property. | Land | Improvement |
|---|---|---|---|---|
| 2025 | $4,861 | $390,108 | $224,910 | $165,198 |
| 2024 | $4,861 | $382,459 | $220,500 | $161,959 |
| 2023 | $4,795 | $374,961 | $216,177 | $158,784 |
| 2022 | $4,586 | $367,610 | $211,939 | $155,671 |
| 2021 | $4,490 | $360,403 | $207,784 | $152,619 |
| 2019 | $4,374 | $349,716 | $201,622 | $148,094 |
| 2018 | $4,208 | $342,860 | $197,669 | $145,191 |
| 2016 | $4,035 | $329,549 | $189,995 | $139,554 |
| 2015 | $3,952 | $324,600 | $187,142 | $137,458 |
| 2014 | $3,900 | $318,243 | $183,477 | $134,766 |
Source: Public Records
Map
Nearby Homes
- 9133 Ramona St Unit 2
- 17458 Deerfield Ave
- 9112 Cedar St
- 9235 Artesia Blvd Unit 5
- 17820 Lakewood Blvd Unit 30
- 17820 Lakewood Blvd Unit 3
- 9253 Rose St
- 9513 Cedar St
- 8723 Artesia Blvd Unit 68
- 6107 Faculty Ave
- 6142 Oliva Ave
- 9224 Walnut St
- 5134 Ashworth St
- 17046 Clark Ave
- 8819 Park St Unit 29
- 6062 Pimenta Ave
- 6034 Pepperwood Ave
- 6023 Whitewood Ave
- 8811 Park St Unit 85
- 4814 Hedda St
- 9120 Ramona St
- 17604 Virginia Ave
- 9124 Ramona St
- 9115 Ramona St
- 9128 Ramona St
- 9121 Ramona St
- 9109 Ramona St
- 9103 Ramona St
- 9125 Ramona St
- 17620 Virginia Ave
- 9134 Ramona St
- 17622 Virginia Ave
- 17452 Virginia Ave
- 17618 Virginia Ave
- 9131 Ramona St
- 17624 Virginia Ave
- 17616 Virginia Ave
- 17626 Virginia Ave
- 17446 Virginia Ave
- 17442 Virginia Ave Unit 5