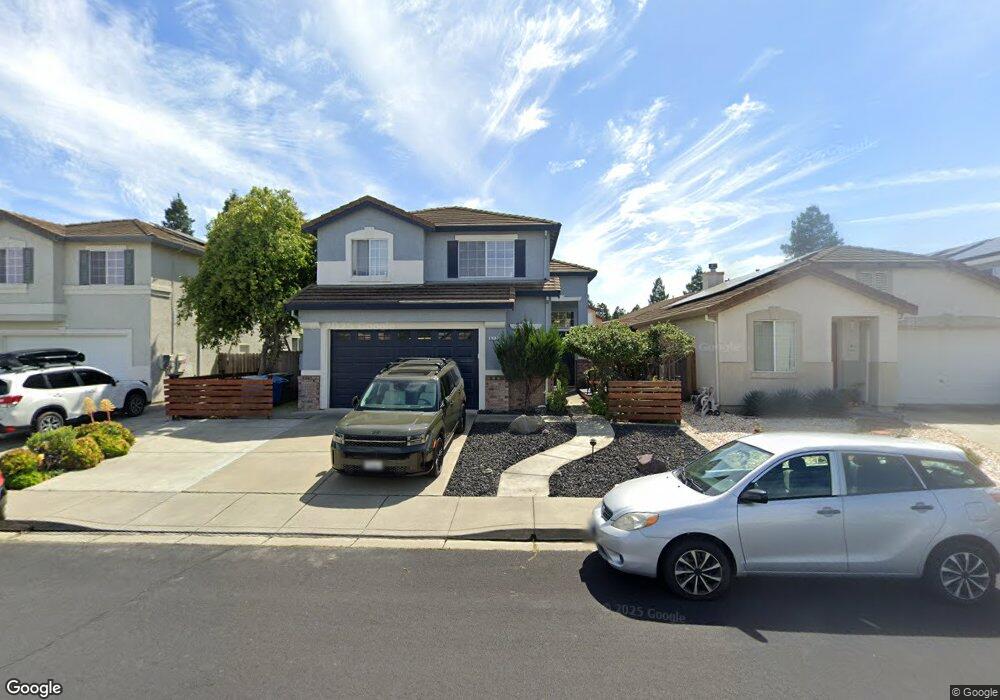
912 Pearwood Ct Vacaville, CA 95687
Estimated Value: $615,000 - $684,000
5
Beds
3
Baths
2,333
Sq Ft
$279/Sq Ft
Est. Value
About This Home
This home is located at 912 Pearwood Ct, Vacaville, CA 95687 and is currently estimated at $651,941, approximately $279 per square foot. 912 Pearwood Ct is a home located in Solano County with nearby schools including Foxboro Elementary School, Golden West Middle School, and Vanden High School.
Ownership History
Date
Name
Owned For
Owner Type
Purchase Details
Closed on
Mar 30, 2015
Sold by
Perry Roy W
Bought by
Perry Roy W
Current Estimated Value
Purchase Details
Closed on
Nov 13, 2012
Sold by
Perry Roy W
Bought by
Perry Roy W
Home Financials for this Owner
Home Financials are based on the most recent Mortgage that was taken out on this home.
Original Mortgage
$321,748
Outstanding Balance
$222,018
Interest Rate
3.36%
Mortgage Type
New Conventional
Estimated Equity
$429,923
Purchase Details
Closed on
Nov 14, 2007
Sold by
Perry Trinidad S
Bought by
Perry Roy W
Home Financials for this Owner
Home Financials are based on the most recent Mortgage that was taken out on this home.
Original Mortgage
$25,000
Interest Rate
6.3%
Mortgage Type
Credit Line Revolving
Purchase Details
Closed on
Feb 9, 1998
Sold by
Lewis Homes Vacaville I
Bought by
Perry Roy W and Perry Trinidad S
Home Financials for this Owner
Home Financials are based on the most recent Mortgage that was taken out on this home.
Original Mortgage
$187,409
Interest Rate
6.97%
Mortgage Type
VA
Create a Home Valuation Report for This Property
The Home Valuation Report is an in-depth analysis detailing your home's value as well as a comparison with similar homes in the area
Home Values in the Area
Average Home Value in this Area
Purchase History
| Date | Buyer | Sale Price | Title Company |
|---|---|---|---|
| Perry Roy W | -- | None Available | |
| Perry Roy W | -- | None Available | |
| Perry Roy W | -- | First American Title | |
| Perry Roy W | $184,000 | Frontier Title Company |
Source: Public Records
Mortgage History
| Date | Status | Borrower | Loan Amount |
|---|---|---|---|
| Open | Perry Roy W | $321,748 | |
| Closed | Perry Roy W | $25,000 | |
| Closed | Perry Roy W | $340,000 | |
| Closed | Perry Roy W | $187,409 |
Source: Public Records
Tax History Compared to Growth
Tax History
| Year | Tax Paid | Tax Assessment Tax Assessment Total Assessment is a certain percentage of the fair market value that is determined by local assessors to be the total taxable value of land and additions on the property. | Land | Improvement |
|---|---|---|---|---|
| 2025 | $2,427 | $300,178 | $79,835 | $220,343 |
| 2024 | $2,427 | $294,293 | $78,270 | $216,023 |
| 2023 | $4,079 | $288,524 | $76,736 | $211,788 |
| 2022 | $3,989 | $282,868 | $75,232 | $207,636 |
| 2021 | $3,979 | $277,322 | $73,757 | $203,565 |
| 2020 | $3,946 | $274,479 | $73,001 | $201,478 |
| 2019 | $3,869 | $269,098 | $71,570 | $197,528 |
| 2018 | $3,811 | $263,822 | $70,167 | $193,655 |
| 2017 | $3,698 | $258,650 | $68,792 | $189,858 |
| 2016 | $3,647 | $253,580 | $67,444 | $186,136 |
| 2015 | $3,606 | $249,772 | $66,431 | $183,341 |
| 2014 | $3,554 | $244,880 | $65,130 | $179,750 |
Source: Public Records
Map
Nearby Homes
- 805 Broadfork Cir
- 925 Cloverbrook Cir
- 1101 Wildplum Ct
- 917 Turquoise St
- 644 Canterbury Cir
- 380 Montgomery Cir
- 845 Turquoise St
- 773 Peregrine Way
- 1048 Stillspring Dr
- 809 Calico Trail
- 790 Morissette Way
- 779 Cookson St
- 766 Calico Trail
- 918 Moonstone Ct
- 2031 Newcastle Dr
- 448 Potters Ln
- 355 Zachary Dr
- 2042 Hamstead Ct
- 4054 Camden Ct
- 236 Cogburn Way
- 918 Pearwood Ct
- 906 Pearwood Ct
- 924 Pearwood Ct
- 900 Pearwood Ct
- 913 Summerbreeze Ct
- 907 Summerbreeze Ct
- 919 Summerbreeze Ct
- 930 Pearwood Ct
- 901 Summerbreeze Ct
- 913 Pearwood Ct
- 925 Summerbreeze Ct
- 919 Pearwood Ct
- 907 Pearwood Ct
- 936 Pearwood Ct
- 925 Pearwood Ct
- 901 Pearwood Ct
- 931 Summerbreeze Ct
- 931 Pearwood Ct
- 942 Pearwood Ct
- 870 Ruby Dr