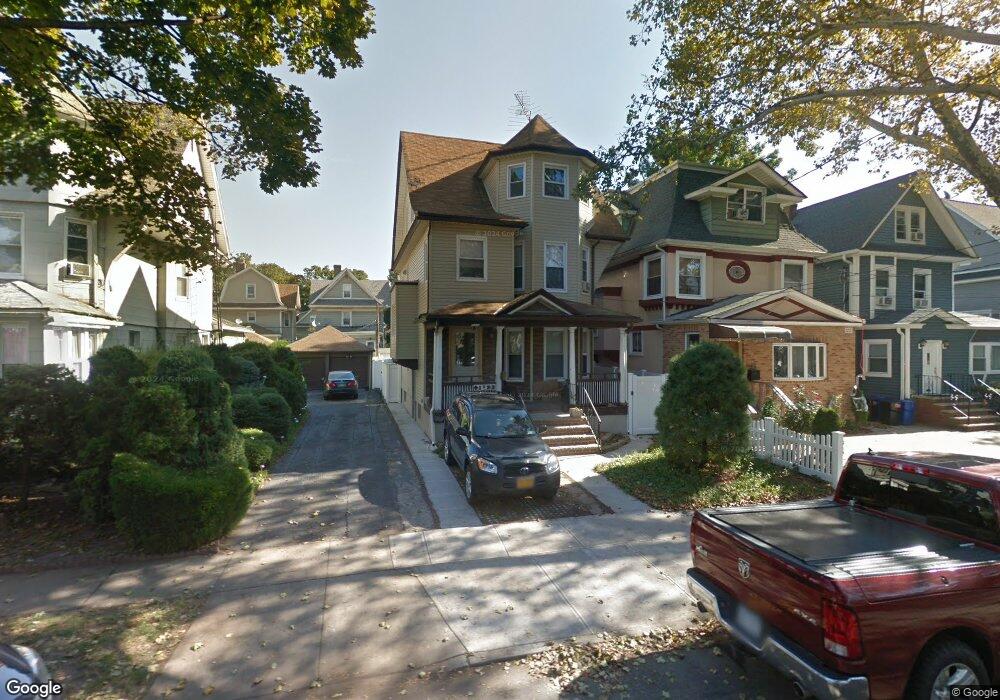
9123 97th St Woodhaven, NY 11421
Woodhaven NeighborhoodEstimated Value: $739,000 - $1,021,000
--
Bed
--
Bath
1,797
Sq Ft
$495/Sq Ft
Est. Value
About This Home
This home is located at 9123 97th St, Woodhaven, NY 11421 and is currently estimated at $888,965, approximately $494 per square foot. 9123 97th St is a home located in Queens County with nearby schools including P.S. 273, Jhs 210 Elizabeth Blackwell, and Richmond Hill High School.
Ownership History
Date
Name
Owned For
Owner Type
Purchase Details
Closed on
May 14, 2024
Sold by
Miseirvitch Steven
Bought by
Juca Jose Ruben Quintuna and Simbana Rosa Matilde
Current Estimated Value
Home Financials for this Owner
Home Financials are based on the most recent Mortgage that was taken out on this home.
Original Mortgage
$591,500
Outstanding Balance
$583,009
Interest Rate
7.09%
Mortgage Type
Purchase Money Mortgage
Estimated Equity
$305,956
Purchase Details
Closed on
Oct 12, 2010
Sold by
Majerski Rose
Bought by
Miseirvitch Florence
Create a Home Valuation Report for This Property
The Home Valuation Report is an in-depth analysis detailing your home's value as well as a comparison with similar homes in the area
Home Values in the Area
Average Home Value in this Area
Purchase History
| Date | Buyer | Sale Price | Title Company |
|---|---|---|---|
| Juca Jose Ruben Quintuna | $845,000 | -- | |
| Miseirvitch Florence | -- | -- | |
| Miseirvitch Steven | -- | -- | |
| Miseirvitch Florence | -- | -- |
Source: Public Records
Mortgage History
| Date | Status | Borrower | Loan Amount |
|---|---|---|---|
| Open | Juca Jose Ruben Quintuna | $591,500 |
Source: Public Records
Tax History Compared to Growth
Tax History
| Year | Tax Paid | Tax Assessment Tax Assessment Total Assessment is a certain percentage of the fair market value that is determined by local assessors to be the total taxable value of land and additions on the property. | Land | Improvement |
|---|---|---|---|---|
| 2025 | $6,383 | $40,255 | $11,576 | $28,679 |
| 2024 | $6,395 | $37,978 | $11,733 | $26,245 |
| 2023 | $5,951 | $35,831 | $11,006 | $24,825 |
| 2022 | $5,788 | $52,260 | $15,960 | $36,300 |
| 2021 | $6,109 | $45,540 | $15,960 | $29,580 |
| 2020 | $5,789 | $45,420 | $15,960 | $29,460 |
| 2019 | $5,323 | $43,800 | $15,960 | $27,840 |
| 2018 | $4,811 | $29,859 | $11,578 | $18,281 |
| 2017 | $5,098 | $29,361 | $13,702 | $15,659 |
| 2016 | $4,976 | $29,361 | $13,702 | $15,659 |
| 2015 | $2,818 | $27,955 | $17,203 | $10,752 |
| 2014 | $2,818 | $26,374 | $17,195 | $9,179 |
Source: Public Records
Map
Nearby Homes