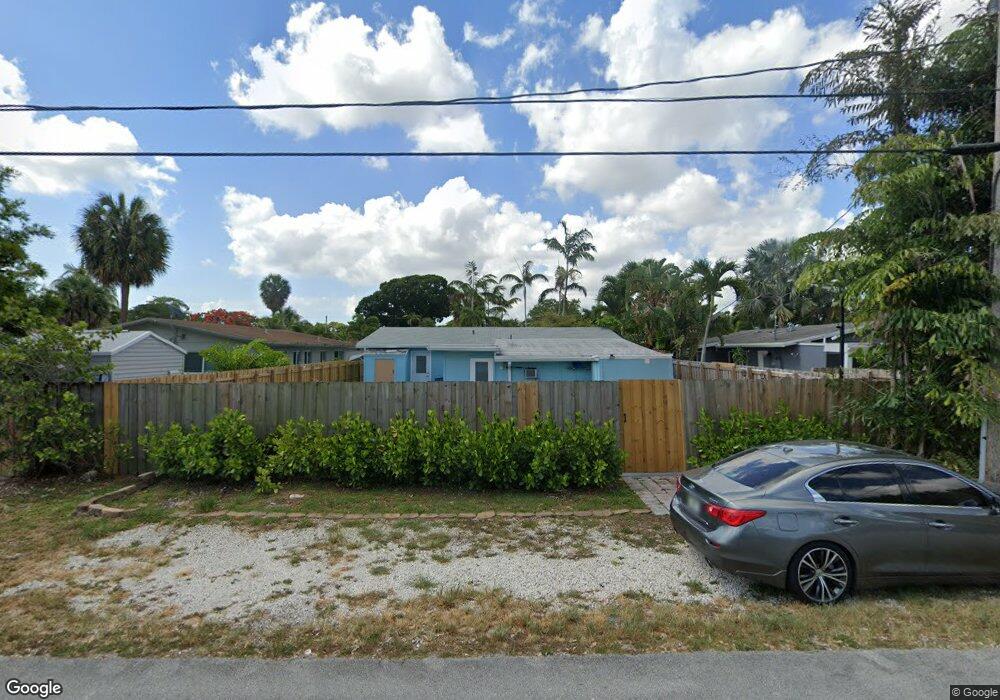
913 NE 18th St Fort Lauderdale, FL 33305
Middle River Terrace NeighborhoodEstimated Value: $613,228 - $746,000
3
Beds
2
Baths
1,492
Sq Ft
$453/Sq Ft
Est. Value
About This Home
This home is located at 913 NE 18th St, Fort Lauderdale, FL 33305 and is currently estimated at $676,057, approximately $453 per square foot. 913 NE 18th St is a home located in Broward County with nearby schools including Bennett Elementary School, Sunrise Middle School, and Fort Lauderdale High School.
Ownership History
Date
Name
Owned For
Owner Type
Purchase Details
Closed on
Sep 3, 2022
Sold by
Hossan Mohammed
Bought by
Rahman Lutfur
Current Estimated Value
Purchase Details
Closed on
Nov 30, 2006
Sold by
Benson Robert B
Bought by
Hossan Mohammed and Hossan Lutfa
Home Financials for this Owner
Home Financials are based on the most recent Mortgage that was taken out on this home.
Original Mortgage
$66,600
Interest Rate
6.36%
Mortgage Type
Credit Line Revolving
Purchase Details
Closed on
Sep 3, 2003
Sold by
Rab Of S Fl Inc
Bought by
Benson Robert B
Home Financials for this Owner
Home Financials are based on the most recent Mortgage that was taken out on this home.
Original Mortgage
$202,500
Interest Rate
6.13%
Mortgage Type
Purchase Money Mortgage
Purchase Details
Closed on
Mar 23, 2003
Sold by
Taylor Michael B and Taylor Vicki L
Bought by
Rab Of S Fla
Purchase Details
Closed on
Aug 1, 1983
Sold by
Available Not
Bought by
Available Not
Create a Home Valuation Report for This Property
The Home Valuation Report is an in-depth analysis detailing your home's value as well as a comparison with similar homes in the area
Home Values in the Area
Average Home Value in this Area
Purchase History
| Date | Buyer | Sale Price | Title Company |
|---|---|---|---|
| Rahman Lutfur | -- | -- | |
| Hossan Mohammed | $333,000 | Title Pros Corp | |
| Benson Robert B | $225,000 | Title Partners Of So Fl Inc | |
| Rab Of S Fla | $35,000 | -- | |
| Available Not | $40,179 | -- |
Source: Public Records
Mortgage History
| Date | Status | Borrower | Loan Amount |
|---|---|---|---|
| Previous Owner | Hossan Mohammed | $66,600 | |
| Previous Owner | Hossan Mohammed | $266,400 | |
| Previous Owner | Benson Robert B | $202,500 |
Source: Public Records
Tax History Compared to Growth
Tax History
| Year | Tax Paid | Tax Assessment Tax Assessment Total Assessment is a certain percentage of the fair market value that is determined by local assessors to be the total taxable value of land and additions on the property. | Land | Improvement |
|---|---|---|---|---|
| 2025 | $11,827 | $602,480 | $30,000 | $572,480 |
| 2024 | $11,310 | $602,480 | $30,000 | $572,480 |
| 2023 | $11,310 | $567,990 | $30,000 | $537,990 |
| 2022 | $3,084 | $176,920 | $0 | $0 |
| 2021 | $2,989 | $171,770 | $0 | $0 |
| 2020 | $2,935 | $169,400 | $0 | $0 |
| 2019 | $2,628 | $165,600 | $0 | $0 |
| 2018 | $2,459 | $162,520 | $0 | $0 |
| 2017 | $2,437 | $159,180 | $0 | $0 |
| 2016 | $2,447 | $155,910 | $0 | $0 |
| 2015 | $2,463 | $154,830 | $0 | $0 |
| 2014 | $2,481 | $153,610 | $0 | $0 |
| 2013 | -- | $151,340 | $30,000 | $121,340 |
Source: Public Records
Map
Nearby Homes
- 1730 NE 9th Ave
- 929 NE 18th Ct
- 928 NE 18th Ct
- 1015 NE 18th St
- 801 NE 18th Ct Unit 209
- 824 NE 17th Ct
- 1000 NE 17th Ct
- 682 Kensington Place
- 657 Cypress Ln Unit 26A
- 658 Kensington Place Unit 11B
- 670 Kensington Place Unit 5B
- 1839 N Dixie Hwy Unit 4
- 1129 NE 18th Ct Unit 1129
- 1133 NE 18th Ct
- 820 NE 17th St
- 725 NE 17th Ct
- 901 NE 16th Place
- 17 Middlesex Dr
- 1009 NE 16th Place
- 1826 N Dixie Hwy Unit 206
- 830 NE 18th Ct Unit 2
- 830 NE 18th Ct Unit 1-3
- 830 NE 18th Ct Unit 1
- 830 NE 18th Ct Unit 3
- 830 NE 18th Ct Unit west
- 830 NE 18th Ct
- 834 NE 18th Ct Unit 3
- 834 NE 18th Ct Unit 1-3
- 834 NE 18th Ct
- 1001 NE 18th St
- 908 NE 18th St
- 915 NE 17th Ct
- 915 NE 17th Ct Unit 915
- 916 NE 18th St
- 1005 NE 18th St
- 901 NE 18th Ct Unit 206
- 901 NE 18th Ct Unit 105
- 901 NE 18th Ct Unit 111
- 901 NE 18th Ct Unit 104
- 901 NE 18th Ct