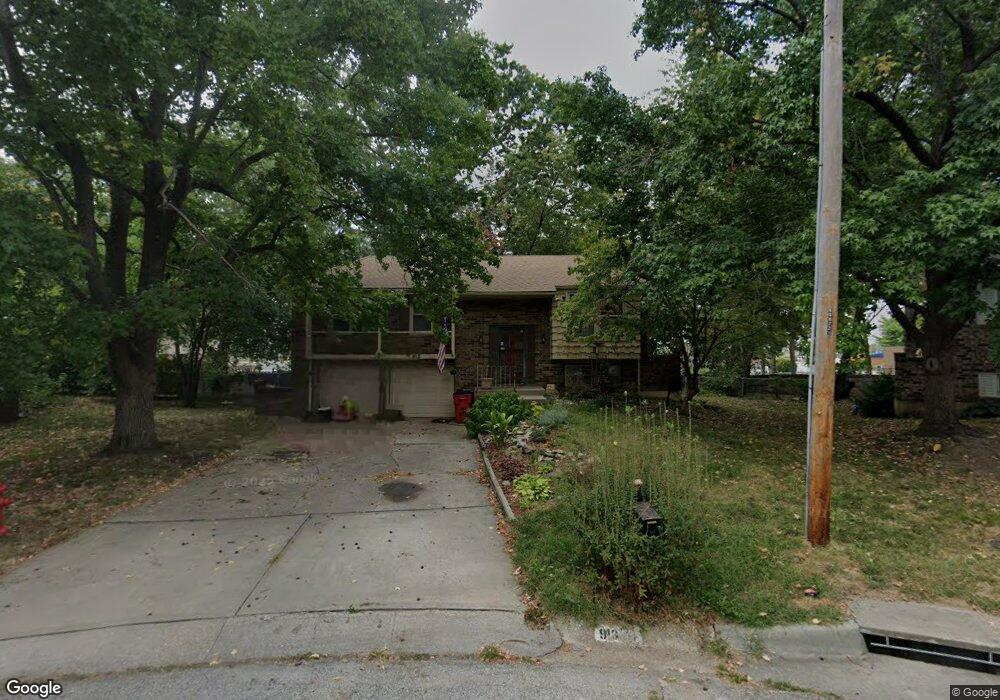
913 NW Canterbury Ct Blue Springs, MO 64015
Estimated Value: $227,000 - $246,000
3
Beds
2
Baths
1,112
Sq Ft
$212/Sq Ft
Est. Value
About This Home
This home is located at 913 NW Canterbury Ct, Blue Springs, MO 64015 and is currently estimated at $235,718, approximately $211 per square foot. 913 NW Canterbury Ct is a home located in Jackson County with nearby schools including James Lewis Elementary School, Brittany Hill Middle School, and Blue Springs High School.
Ownership History
Date
Name
Owned For
Owner Type
Purchase Details
Closed on
Jun 29, 2006
Sold by
Mcbratney John P
Bought by
Mcbratney John P and Mcbratney Patricia A
Current Estimated Value
Home Financials for this Owner
Home Financials are based on the most recent Mortgage that was taken out on this home.
Original Mortgage
$121,500
Outstanding Balance
$71,672
Interest Rate
6.63%
Mortgage Type
Stand Alone Refi Refinance Of Original Loan
Estimated Equity
$164,046
Purchase Details
Closed on
May 20, 2004
Sold by
Shumate Tamara
Bought by
Mcbratney John P
Home Financials for this Owner
Home Financials are based on the most recent Mortgage that was taken out on this home.
Original Mortgage
$115,000
Interest Rate
7.99%
Mortgage Type
Purchase Money Mortgage
Purchase Details
Closed on
Oct 10, 2000
Sold by
Shumate Tamara J
Bought by
Shumate Tjh and Tjh Shumate Revocable Living Trust
Purchase Details
Closed on
Feb 20, 1996
Sold by
Shumate Tamara J and Shumate J H T
Bought by
Shumate T J H and T J H Shumate Revocable Living Trust
Create a Home Valuation Report for This Property
The Home Valuation Report is an in-depth analysis detailing your home's value as well as a comparison with similar homes in the area
Home Values in the Area
Average Home Value in this Area
Purchase History
| Date | Buyer | Sale Price | Title Company |
|---|---|---|---|
| Mcbratney John P | -- | Title Enterprises | |
| Mcbratney John P | -- | Ctic | |
| Shumate Tjh | -- | Columbian National Title | |
| Shumate Tamara J | -- | Columbian National Title | |
| Shumate T J H | -- | -- |
Source: Public Records
Mortgage History
| Date | Status | Borrower | Loan Amount |
|---|---|---|---|
| Open | Mcbratney John P | $121,500 | |
| Closed | Mcbratney John P | $115,000 |
Source: Public Records
Tax History Compared to Growth
Tax History
| Year | Tax Paid | Tax Assessment Tax Assessment Total Assessment is a certain percentage of the fair market value that is determined by local assessors to be the total taxable value of land and additions on the property. | Land | Improvement |
|---|---|---|---|---|
| 2025 | $2,635 | $33,670 | $6,289 | $27,381 |
| 2024 | $2,635 | $32,300 | $6,200 | $26,100 |
| 2023 | $3,149 | $39,359 | $5,170 | $34,189 |
| 2022 | $2,305 | $25,460 | $5,453 | $20,007 |
| 2021 | $2,303 | $25,460 | $5,453 | $20,007 |
| 2020 | $2,054 | $23,098 | $5,453 | $17,645 |
| 2019 | $1,986 | $23,098 | $5,453 | $17,645 |
| 2018 | $892,490 | $22,294 | $3,695 | $18,599 |
| 2017 | $1,991 | $22,294 | $3,695 | $18,599 |
| 2016 | $1,936 | $21,736 | $2,755 | $18,981 |
| 2014 | $1,732 | $19,380 | $2,780 | $16,600 |
Source: Public Records
Map
Nearby Homes
- 3212 NW Canterbury Rd
- 3213 NW Canterbury Place
- 1029 NW Berkshire Dr
- 2916 NW Chelsea Place
- 704 NW 39th St
- 4012 NW Delwood Ct
- 516 NW Mill Ct
- 3605 NW Dogwood Dr
- 913 NW Camelot Ct
- 3616 NW Dogwood Dr
- 2508 NW Castle Dr
- 4301 NW Briarwood Dr
- 2317 NW Kensington Ct
- 41 Clipper Dr
- 1618 NW Samantha Ct
- 124 SW 27th St
- 4075 SW M 7 Hwy
- 4317 NW R D Mize Rd
- 14 Emerald Shore Dr
- 4508 NW Valley View Rd
- 917 NW Canterbury Ct
- 909 NW Canterbury Ct
- 921 NW Canterbury Ct
- 905 NW Canterbury Ct
- 925 NW Canterbury Ct
- 3213 NW Canterbury Rd
- 901 NW Canterbury Rd
- 904 NW Canterbury Rd
- 900 NW Canterbury Rd
- 3209 NW Canterbury Rd
- 3208 NW Canterbury Rd
- 816 NW Buckingham Place
- 3301 NW Canterbury Place
- 1141 NW Arlington Place
- 815 NW Canterbury Rd
- 3205 NW Canterbury Rd
- 820 NW Buckingham Place
- 3204 NW Canterbury Rd
- 3205 NW Canterbury Place