Estimated Value: $294,000 - $313,000
--
Bed
2
Baths
1,796
Sq Ft
$168/Sq Ft
Est. Value
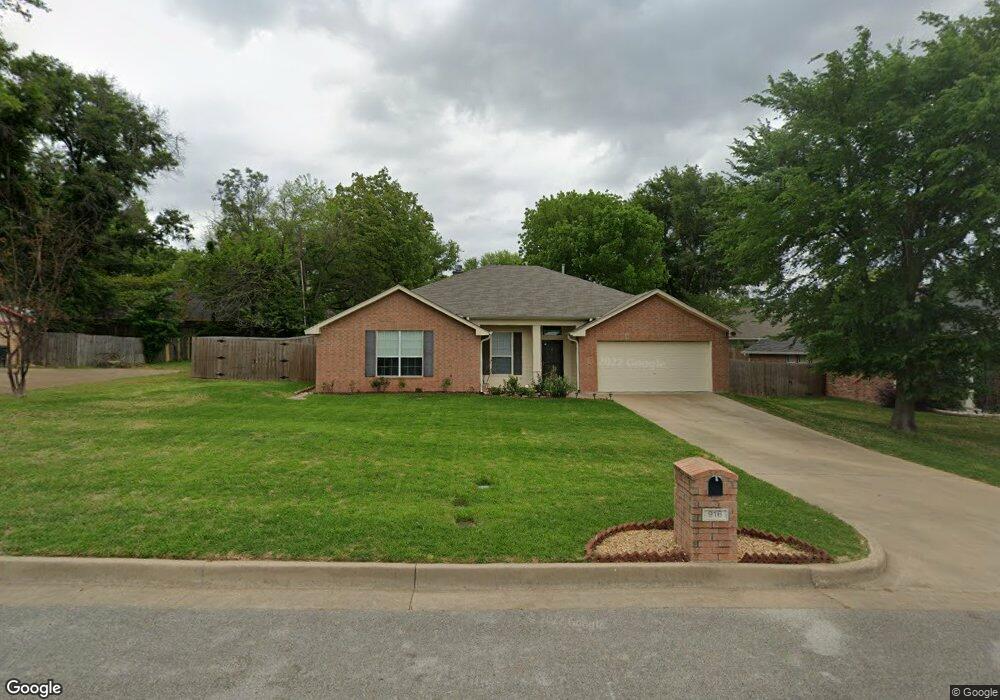
About This Home
This home is located at 916 Joel Dr, Tyler, TX 75703 and is currently estimated at $302,436, approximately $168 per square foot. 916 Joel Dr is a home located in Smith County with nearby schools including Rice Elementary School, Hubbard Middle School, and Tyler Legacy High School.
Ownership History
Date
Name
Owned For
Owner Type
Purchase Details
Closed on
Feb 22, 2019
Sold by
Grace Tracy and Grace Robert
Bought by
Johnson Troy and Johnson Zoila E
Current Estimated Value
Home Financials for this Owner
Home Financials are based on the most recent Mortgage that was taken out on this home.
Original Mortgage
$129,150
Outstanding Balance
$113,083
Interest Rate
4.4%
Mortgage Type
Purchase Money Mortgage
Estimated Equity
$189,353
Purchase Details
Closed on
Aug 19, 2013
Sold by
Reeves Irvin D and Reeves Linda D
Bought by
Steinthal Milton W
Purchase Details
Closed on
Jul 14, 2005
Sold by
Conaway & Sons Ltd
Bought by
Reeves Irvin D and Reeves Linda D
Home Financials for this Owner
Home Financials are based on the most recent Mortgage that was taken out on this home.
Original Mortgage
$113,490
Interest Rate
5.64%
Mortgage Type
New Conventional
Create a Home Valuation Report for This Property
The Home Valuation Report is an in-depth analysis detailing your home's value as well as a comparison with similar homes in the area
Home Values in the Area
Average Home Value in this Area
Purchase History
| Date | Buyer | Sale Price | Title Company |
|---|---|---|---|
| Johnson Troy | -- | None Available | |
| Steinthal Milton W | -- | None Available | |
| Reeves Irvin D | -- | Fa | |
| Reeves Irvin D | -- | Fa |
Source: Public Records
Mortgage History
| Date | Status | Borrower | Loan Amount |
|---|---|---|---|
| Open | Johnson Troy | $129,150 | |
| Previous Owner | Reeves Irvin D | $113,490 |
Source: Public Records
Tax History Compared to Growth
Tax History
| Year | Tax Paid | Tax Assessment Tax Assessment Total Assessment is a certain percentage of the fair market value that is determined by local assessors to be the total taxable value of land and additions on the property. | Land | Improvement |
|---|---|---|---|---|
| 2025 | $5,717 | $336,920 | $43,400 | $293,520 |
| 2024 | $5,717 | $336,059 | $24,599 | $311,460 |
| 2023 | $5,592 | $320,793 | $24,599 | $296,194 |
| 2022 | $5,516 | $281,539 | $24,599 | $256,940 |
| 2021 | $4,517 | $215,320 | $24,599 | $190,721 |
| 2020 | $4,263 | $199,242 | $20,258 | $178,984 |
| 2019 | $4,282 | $195,843 | $18,088 | $177,755 |
| 2018 | $4,077 | $187,437 | $18,088 | $169,349 |
| 2017 | $3,751 | $175,691 | $14,470 | $161,221 |
| 2016 | $3,604 | $168,806 | $14,470 | $154,336 |
| 2015 | $1,843 | $162,412 | $14,470 | $147,942 |
| 2014 | $1,843 | $154,207 | $14,470 | $139,737 |
Source: Public Records
Map
Nearby Homes
- 915 Pam Dr
- 903 Joel Dr
- 821 Pam Dr
- 1302 Jeb Stuart Dr
- 801 Beth Dr
- 1302 Jeff Davis Dr
- 815 E Grande Blvd
- 759 Hampton Hill Dr
- 8307 Garrett Dr
- 619 Wellington St
- 526 Ronnette Dr
- 719 Cambridge Bend Cir
- 708 Oxford Cir
- 700 Oxford Dr
- 604 Wellington St
- 505 Bentley Ct
- 6102 Wilderness Rd
- 6109 Quail Creek Dr
- 6522 Emory Ct
- 8301 Paluxy Dr