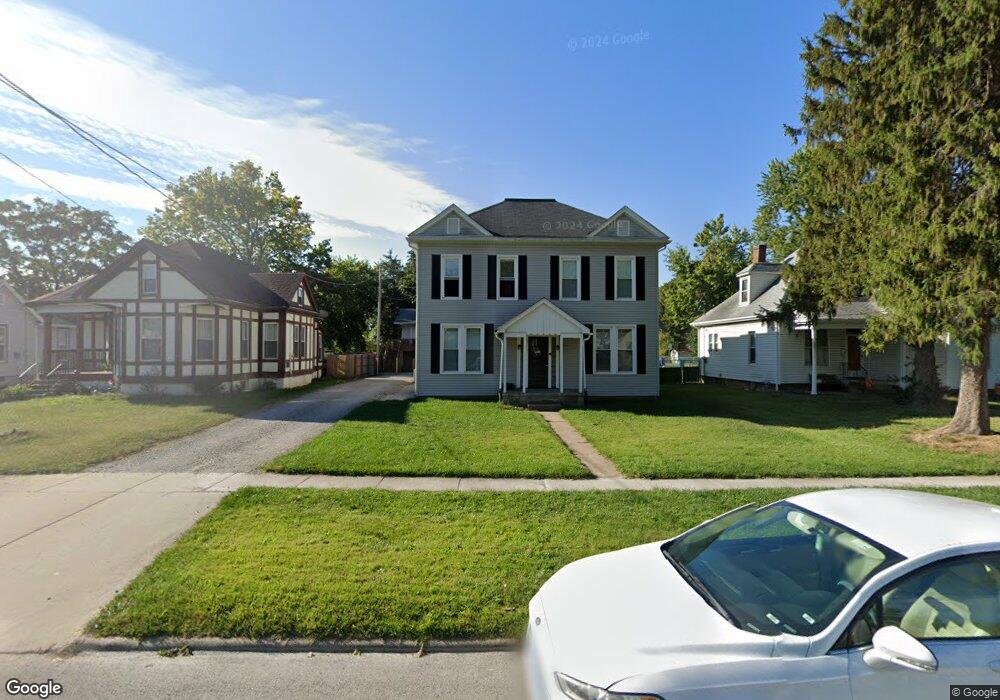
916 W Clay St Collinsville, IL 62234
Estimated Value: $191,000 - $283,642
7
Beds
1
Bath
4,132
Sq Ft
$55/Sq Ft
Est. Value
About This Home
This home is located at 916 W Clay St, Collinsville, IL 62234 and is currently estimated at $226,881, approximately $54 per square foot. 916 W Clay St is a home located in Madison County with nearby schools including Summit Elementary School, Dorris Intermediate School, and Collinsville Middle School.
Ownership History
Date
Name
Owned For
Owner Type
Purchase Details
Closed on
Dec 5, 2019
Sold by
Quinlan Trust
Bought by
Rbt Holdings Llc
Current Estimated Value
Home Financials for this Owner
Home Financials are based on the most recent Mortgage that was taken out on this home.
Original Mortgage
$80,000
Interest Rate
3.6%
Mortgage Type
New Conventional
Purchase Details
Closed on
Jul 14, 2008
Sold by
Quinlan Kenneth L and Quinlan Patricia E
Bought by
Quinlan Kenneth L
Purchase Details
Closed on
Jun 15, 2007
Sold by
Quinlan Patricia A
Bought by
Quinlan Kenneth L
Create a Home Valuation Report for This Property
The Home Valuation Report is an in-depth analysis detailing your home's value as well as a comparison with similar homes in the area
Home Values in the Area
Average Home Value in this Area
Purchase History
| Date | Buyer | Sale Price | Title Company |
|---|---|---|---|
| Rbt Holdings Llc | $100,000 | Abstracts & Titles | |
| Quinlan Kenneth L | -- | None Available | |
| Quinlan Kenneth L | -- | None Available |
Source: Public Records
Mortgage History
| Date | Status | Borrower | Loan Amount |
|---|---|---|---|
| Closed | Rbt Holdings Llc | $80,000 |
Source: Public Records
Tax History Compared to Growth
Tax History
| Year | Tax Paid | Tax Assessment Tax Assessment Total Assessment is a certain percentage of the fair market value that is determined by local assessors to be the total taxable value of land and additions on the property. | Land | Improvement |
|---|---|---|---|---|
| 2024 | $6,288 | $98,360 | $7,200 | $91,160 |
| 2023 | $6,288 | $91,040 | $6,660 | $84,380 |
| 2022 | $2,521 | $38,130 | $5,960 | $32,170 |
| 2021 | $2,474 | $35,820 | $5,600 | $30,220 |
| 2020 | $2,385 | $34,170 | $5,340 | $28,830 |
| 2019 | $2,517 | $35,770 | $5,160 | $30,610 |
| 2018 | $3,374 | $46,480 | $4,870 | $41,610 |
| 2017 | $3,380 | $45,550 | $4,770 | $40,780 |
| 2016 | $3,560 | $45,550 | $4,770 | $40,780 |
| 2015 | $3,321 | $44,370 | $4,650 | $39,720 |
| 2014 | $3,321 | $44,370 | $4,650 | $39,720 |
| 2013 | $3,321 | $44,370 | $4,650 | $39,720 |
Source: Public Records
Map
Nearby Homes
- 205 Audrey Ave
- 126 Collinsville Ave
- 108 Westridge Dr
- 101 Westminster Dr
- 611 W Main St
- 119 N Hesperia St
- 221 N Hesperia St Unit 221 A and 221 B
- 746 Maple St
- 300 N Combs Ave
- 820 Bond Ave
- 125 S Hesperia St
- 506 W Clay St
- 0 Elm St
- Lot 32 Jefferson Ave
- 419 Bell St
- 510 N Combs Ave
- Lot 37 Jefferson Ave
- Lot 38 Jefferson Ave
- Lot 36 Jefferson Ave
- 128 Courtland Place