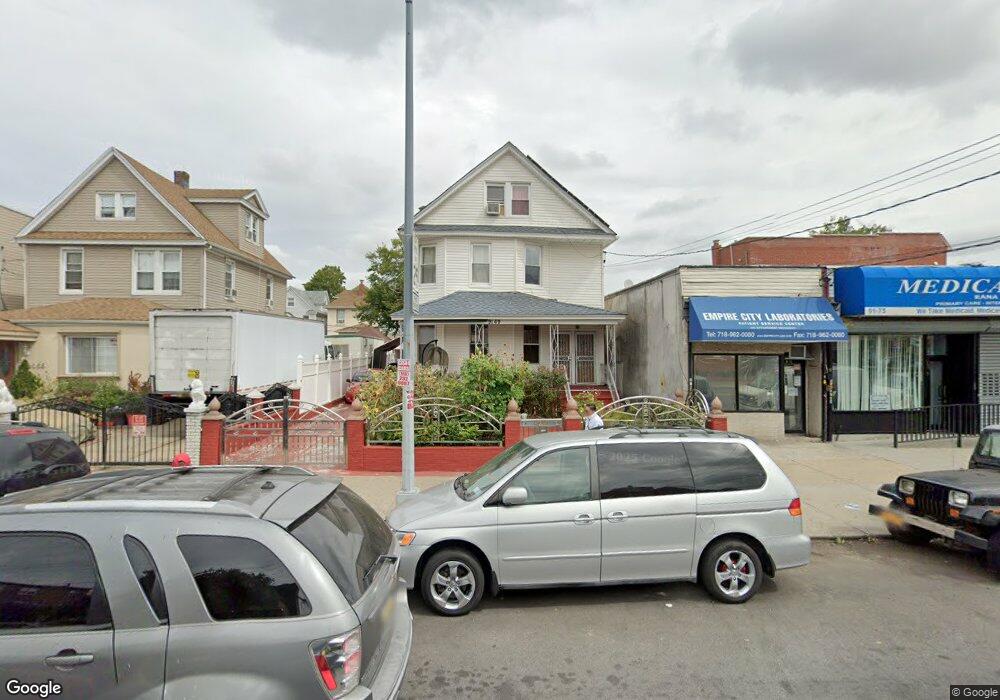
9169 111th St Richmond Hill, NY 11418
Richmond Hill NeighborhoodEstimated Value: $1,071,000 - $1,296,000
--
Bed
--
Bath
3,360
Sq Ft
$352/Sq Ft
Est. Value
About This Home
This home is located at 9169 111th St, Richmond Hill, NY 11418 and is currently estimated at $1,182,787, approximately $352 per square foot. 9169 111th St is a home located in Queens County with nearby schools including P.S. 90 - Horace Mann, M.S.137 America's School of Heroes, and Richmond Hill High School.
Ownership History
Date
Name
Owned For
Owner Type
Purchase Details
Closed on
May 7, 2021
Sold by
Barran Carol and Barran Joseph
Bought by
Moonsee Oma and Moonsee Peter
Current Estimated Value
Purchase Details
Closed on
Jun 25, 2010
Sold by
Naraine Kushumdei and Naraine Viswa
Bought by
Barran Carol and Barran Joseph
Home Financials for this Owner
Home Financials are based on the most recent Mortgage that was taken out on this home.
Original Mortgage
$616,006
Interest Rate
4.82%
Mortgage Type
Purchase Money Mortgage
Create a Home Valuation Report for This Property
The Home Valuation Report is an in-depth analysis detailing your home's value as well as a comparison with similar homes in the area
Home Values in the Area
Average Home Value in this Area
Purchase History
| Date | Buyer | Sale Price | Title Company |
|---|---|---|---|
| Moonsee Oma | -- | -- | |
| Barran Carol | $645,000 | -- |
Source: Public Records
Mortgage History
| Date | Status | Borrower | Loan Amount |
|---|---|---|---|
| Previous Owner | Barran Carol | $616,006 |
Source: Public Records
Tax History Compared to Growth
Tax History
| Year | Tax Paid | Tax Assessment Tax Assessment Total Assessment is a certain percentage of the fair market value that is determined by local assessors to be the total taxable value of land and additions on the property. | Land | Improvement |
|---|---|---|---|---|
| 2025 | $9,626 | $48,276 | $15,160 | $33,116 |
| 2024 | $9,626 | $47,928 | $16,421 | $31,507 |
| 2023 | $9,183 | $45,216 | $14,061 | $31,155 |
| 2022 | $7,650 | $60,420 | $19,200 | $41,220 |
| 2021 | $7,705 | $60,540 | $19,200 | $41,340 |
| 2020 | $7,252 | $57,780 | $19,200 | $38,580 |
| 2019 | $7,091 | $52,320 | $19,200 | $33,120 |
| 2018 | $7,681 | $37,680 | $19,200 | $18,480 |
| 2017 | $7,585 | $37,208 | $17,718 | $19,490 |
| 2016 | $7,099 | $37,208 | $17,718 | $19,490 |
| 2015 | $3,970 | $33,525 | $18,361 | $15,164 |
| 2014 | $3,970 | $33,525 | $19,597 | $13,928 |
Source: Public Records
Map
Nearby Homes