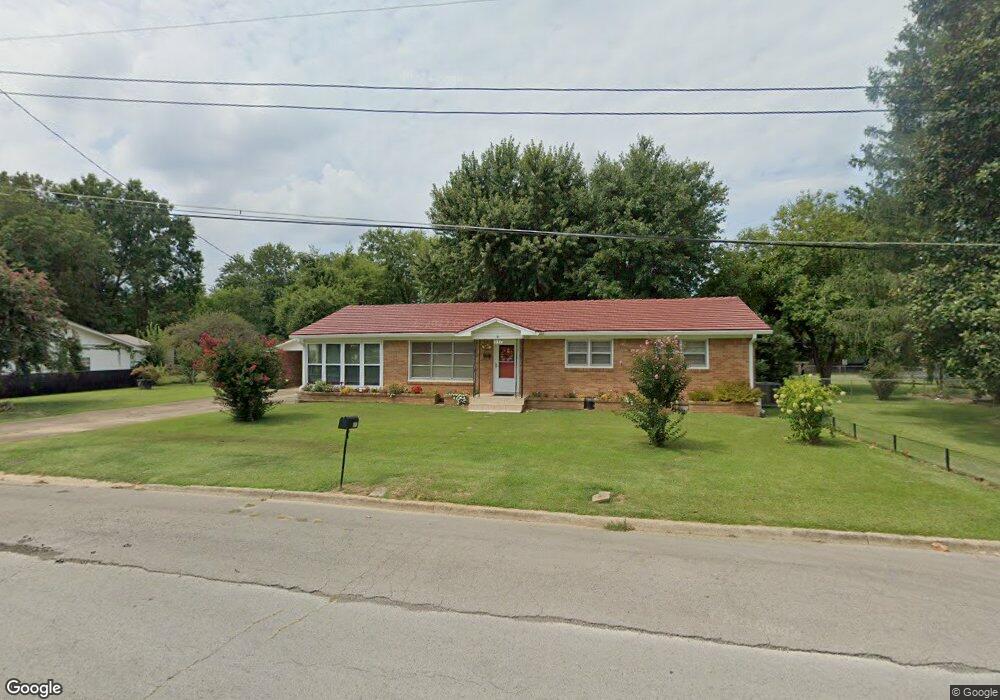
917 Evans Dr Lawrenceburg, TN 38464
Estimated Value: $176,000 - $218,000
--
Bed
1
Bath
1,370
Sq Ft
$143/Sq Ft
Est. Value
About This Home
This home is located at 917 Evans Dr, Lawrenceburg, TN 38464 and is currently estimated at $196,279, approximately $143 per square foot. 917 Evans Dr is a home located in Lawrence County with nearby schools including Ingram Sowell Elementary School, David Crockett Elementary School, and Lawrenceburg Public Elementary School.
Ownership History
Date
Name
Owned For
Owner Type
Purchase Details
Closed on
Aug 25, 2014
Sold by
Mcculloch Thomas L
Bought by
Mcculloch Deanna
Current Estimated Value
Purchase Details
Closed on
Dec 12, 2003
Sold by
Etal Boswell Willadean
Bought by
Mcculloch Thomas L and Mcculloch Deanna M
Purchase Details
Closed on
Sep 12, 1996
Sold by
Stone Opal M
Bought by
Mayney Odie L
Purchase Details
Closed on
Apr 18, 1974
Bought by
Stone Frank C and Stone Opal M
Create a Home Valuation Report for This Property
The Home Valuation Report is an in-depth analysis detailing your home's value as well as a comparison with similar homes in the area
Home Values in the Area
Average Home Value in this Area
Purchase History
| Date | Buyer | Sale Price | Title Company |
|---|---|---|---|
| Mcculloch Deanna | -- | -- | |
| Mcculloch Thomas L | $58,000 | -- | |
| Mayney Odie L | $56,500 | -- | |
| Stone Frank C | -- | -- |
Source: Public Records
Tax History Compared to Growth
Tax History
| Year | Tax Paid | Tax Assessment Tax Assessment Total Assessment is a certain percentage of the fair market value that is determined by local assessors to be the total taxable value of land and additions on the property. | Land | Improvement |
|---|---|---|---|---|
| 2025 | $1,104 | $35,525 | $0 | $0 |
| 2024 | $1,104 | $35,525 | $3,125 | $32,400 |
| 2023 | $1,104 | $35,525 | $3,125 | $32,400 |
| 2022 | $1,104 | $35,525 | $3,125 | $32,400 |
| 2021 | $842 | $19,150 | $2,500 | $16,650 |
| 2020 | $842 | $19,150 | $2,500 | $16,650 |
| 2019 | $842 | $19,150 | $2,500 | $16,650 |
| 2018 | $842 | $19,150 | $2,500 | $16,650 |
| 2017 | $842 | $19,150 | $2,500 | $16,650 |
| 2016 | $842 | $19,150 | $2,500 | $16,650 |
| 2015 | $797 | $19,150 | $2,500 | $16,650 |
| 2014 | $829 | $19,925 | $2,500 | $17,425 |
Source: Public Records
Map
Nearby Homes