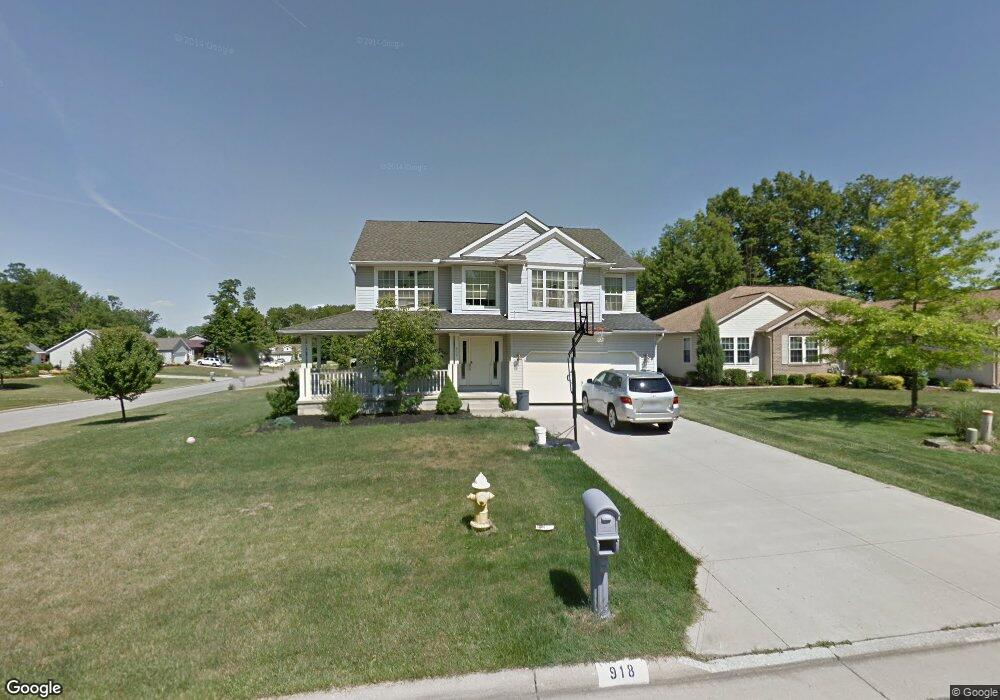
918 Randallwood Dr Ontario, OH 44906
Estimated Value: $300,000 - $411,000
3
Beds
3
Baths
2,686
Sq Ft
$127/Sq Ft
Est. Value
About This Home
This home is located at 918 Randallwood Dr, Ontario, OH 44906 and is currently estimated at $340,079, approximately $126 per square foot. 918 Randallwood Dr is a home located in Richland County with nearby schools including Stingel Elementary School, Ontario Middle School, and Ontario High School.
Ownership History
Date
Name
Owned For
Owner Type
Purchase Details
Closed on
Jul 29, 2013
Sold by
Xia Wen Chen Chuan and Xia Juan Lin
Bought by
Ying Chen Li
Current Estimated Value
Purchase Details
Closed on
Nov 5, 2007
Sold by
Fannie Mae
Bought by
Xiao Si Chun and Wen Chen Chuan
Home Financials for this Owner
Home Financials are based on the most recent Mortgage that was taken out on this home.
Original Mortgage
$137,000
Interest Rate
6.45%
Mortgage Type
Purchase Money Mortgage
Purchase Details
Closed on
Apr 30, 2007
Sold by
Sparks Derrick M and Washington Mutual Bank Fa
Bought by
Federal National Mortgage Association
Purchase Details
Closed on
Jul 9, 2003
Sold by
Stander Richard R and Stander Joyce A
Bought by
Sparks Derrick M and Sparks Toya R
Home Financials for this Owner
Home Financials are based on the most recent Mortgage that was taken out on this home.
Original Mortgage
$182,784
Interest Rate
5.3%
Mortgage Type
Construction
Create a Home Valuation Report for This Property
The Home Valuation Report is an in-depth analysis detailing your home's value as well as a comparison with similar homes in the area
Home Values in the Area
Average Home Value in this Area
Purchase History
| Date | Buyer | Sale Price | Title Company |
|---|---|---|---|
| Ying Chen Li | $86,000 | Attorney | |
| Xiao Si Chun | $172,000 | Title First Agency | |
| Federal National Mortgage Association | $150,000 | None Available | |
| Sparks Derrick M | $26,000 | -- |
Source: Public Records
Mortgage History
| Date | Status | Borrower | Loan Amount |
|---|---|---|---|
| Previous Owner | Xiao Si Chun | $137,000 | |
| Previous Owner | Sparks Derrick M | $182,784 |
Source: Public Records
Tax History Compared to Growth
Tax History
| Year | Tax Paid | Tax Assessment Tax Assessment Total Assessment is a certain percentage of the fair market value that is determined by local assessors to be the total taxable value of land and additions on the property. | Land | Improvement |
|---|---|---|---|---|
| 2024 | $4,378 | $85,940 | $5,680 | $80,260 |
| 2023 | $4,378 | $85,940 | $5,680 | $80,260 |
| 2022 | $3,904 | $65,990 | $5,200 | $60,790 |
| 2021 | $3,911 | $65,990 | $5,200 | $60,790 |
| 2020 | $4,177 | $65,990 | $5,200 | $60,790 |
| 2019 | $3,911 | $55,930 | $4,410 | $51,520 |
| 2018 | $3,334 | $55,930 | $4,410 | $51,520 |
| 2017 | $3,234 | $55,110 | $4,410 | $50,700 |
| 2016 | $3,402 | $57,640 | $4,280 | $53,360 |
| 2015 | $3,402 | $57,640 | $4,280 | $53,360 |
| 2014 | $3,405 | $57,640 | $4,280 | $53,360 |
| 2012 | $1,599 | $59,420 | $4,410 | $55,010 |
Source: Public Records
Map
Nearby Homes
- 1947 Teakwood Dr
- 1915 Teakwood Dr Unit 1915
- 1909 Teakwood Dr
- 2010 Teakwood Dr
- 2007 Teakwood Dr
- 720 Lindaire Ln E
- 1980 Walker Lake Rd
- 2270 Ferguson Rd
- 648 Villa Dr Unit 648
- 700 Villa Dr
- 655 Villa Dr
- 0 Spring Village Ln
- 1396 Spring Village Dr Unit 1398
- Lot 2 Spring Village Ln
- 1598-1600 Spring Village Ln
- 1592 Walker Woods Blvd
- 1631 Deer View Cir
- 1496 W 4th St
- 2585 Deerfield Ln
- 1996 Park Ave W
- 912 Randallwood Dr
- 2009 Teakwood Dr
- 1956 Teakwood Dr
- 917 Randallwood Dr
- 1960 Teakwood Dr
- 911 Randallwood Dr
- 1941 Teakwood Dr
- 906 Randallwood Dr
- 1950 Teakwood Dr
- 1938 Teakwood Dr
- 1932 Teakwood Dr
- 1935 Teakwood Dr
- 880 Randallwood Dr
- 1982 Teakwood Dr
- 1926 Teakwood Dr
- 1954 Rosewood Dr
- 1923 Teakwood Dr
- 895 Randallwood Dr
- 895 Randallwood Dr
- 1933 Sandelwood Dr