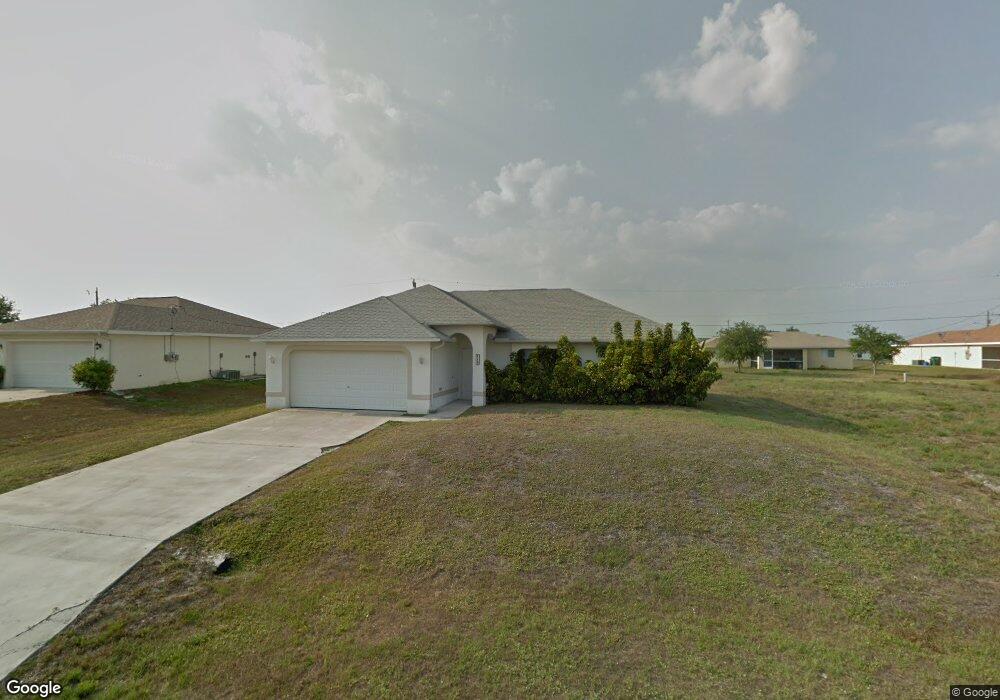
919 NE 18th St Cape Coral, FL 33909
Diplomat NeighborhoodEstimated Value: $247,000 - $299,000
3
Beds
2
Baths
1,479
Sq Ft
$186/Sq Ft
Est. Value
About This Home
This home is located at 919 NE 18th St, Cape Coral, FL 33909 and is currently estimated at $274,499, approximately $185 per square foot. 919 NE 18th St is a home located in Lee County with nearby schools including Dr. Carrie D. Robinson Littleton Elementary School, Caloosa Elementary School, and Tropic Isles Elementary School.
Ownership History
Date
Name
Owned For
Owner Type
Purchase Details
Closed on
Jun 11, 2009
Sold by
Hsbc Bank Usa National Association
Bought by
Dahan Meir and Romano Orli
Current Estimated Value
Purchase Details
Closed on
Apr 20, 2009
Sold by
Gallardo Bertha S
Bought by
Hsbc Bank Usa National Association
Purchase Details
Closed on
Sep 21, 2005
Sold by
Lee Wook
Bought by
Gallardo Bertha S
Home Financials for this Owner
Home Financials are based on the most recent Mortgage that was taken out on this home.
Original Mortgage
$179,200
Interest Rate
7.55%
Mortgage Type
Unknown
Purchase Details
Closed on
Jul 2, 2004
Sold by
Cooke Elizabeth
Bought by
Lee Wook
Purchase Details
Closed on
Jun 25, 2004
Sold by
Colpo Paul and Colpo Janet D
Bought by
Cooke Elizabeth
Create a Home Valuation Report for This Property
The Home Valuation Report is an in-depth analysis detailing your home's value as well as a comparison with similar homes in the area
Home Values in the Area
Average Home Value in this Area
Purchase History
| Date | Buyer | Sale Price | Title Company |
|---|---|---|---|
| Dahan Meir | $58,000 | Rels Title | |
| Hsbc Bank Usa National Association | -- | None Available | |
| Gallardo Bertha S | $224,000 | Towns Title & Co Inc | |
| Lee Wook | $35,000 | -- | |
| Cooke Elizabeth | $25,000 | -- |
Source: Public Records
Mortgage History
| Date | Status | Borrower | Loan Amount |
|---|---|---|---|
| Previous Owner | Gallardo Bertha S | $179,200 |
Source: Public Records
Tax History Compared to Growth
Tax History
| Year | Tax Paid | Tax Assessment Tax Assessment Total Assessment is a certain percentage of the fair market value that is determined by local assessors to be the total taxable value of land and additions on the property. | Land | Improvement |
|---|---|---|---|---|
| 2025 | $4,238 | $215,593 | -- | -- |
| 2024 | $4,077 | $195,994 | -- | -- |
| 2023 | $4,077 | $178,176 | $0 | $0 |
| 2022 | $3,518 | $161,978 | $0 | $0 |
| 2021 | $3,124 | $147,253 | $8,700 | $138,553 |
| 2020 | $3,030 | $137,271 | $8,600 | $128,671 |
| 2019 | $2,895 | $133,234 | $8,500 | $124,734 |
| 2018 | $2,805 | $134,856 | $11,000 | $123,856 |
| 2017 | $2,681 | $129,203 | $7,100 | $122,103 |
| 2016 | $2,446 | $113,278 | $7,100 | $106,178 |
| 2015 | $2,255 | $98,991 | $6,500 | $92,491 |
| 2014 | $2,106 | $93,999 | $5,922 | $88,077 |
| 2013 | -- | $80,897 | $5,300 | $75,597 |
Source: Public Records
Map
Nearby Homes
- 1815 NE 10th Ave
- 1800 NE 10th Place
- 915 NE 19th St
- 923 NE 17th St
- 1903 NE 10th Ave
- 905 NE 17th St
- 1816 NE 8th Place
- 1702 NE 10th Place
- 1813 Andalusia Blvd
- 1013 NE 16th Terrace
- 1910 NE 8th Place
- 1828 Andalusia Blvd
- 1112 NE 19th St
- 1414 NE 20th St
- 618 NE 20th St Unit 11
- 1108 NE 19th Terrace
- 1626 Andalusia Blvd
- 2017 NE 10th Place
- 1203 NE 19th Terrace
- 335 NE 19th Terrace
- 915 NE 18th St
- 918 NE 18th Terrace Unit 32
- 922 NE 18th Terrace
- 914 NE 18th Terrace
- 911 NE 18th St
- 920 NE 18th St
- 926 NE 18th Terrace
- 912 NE 18th St
- 927 NE 18th St
- 926 NE 18th St
- 907 NE 18th St
- 901 NE 18th Terrace
- 919 NE 18th Terrace
- 919 NE 17th Terrace
- 923 NE 18th Terrace
- 915 NE 17th Terrace
- 1807 NE 10th Ave
- 904 NE 18th St
- 1803 NE 10th Ave
- 1811 NE 10th Ave