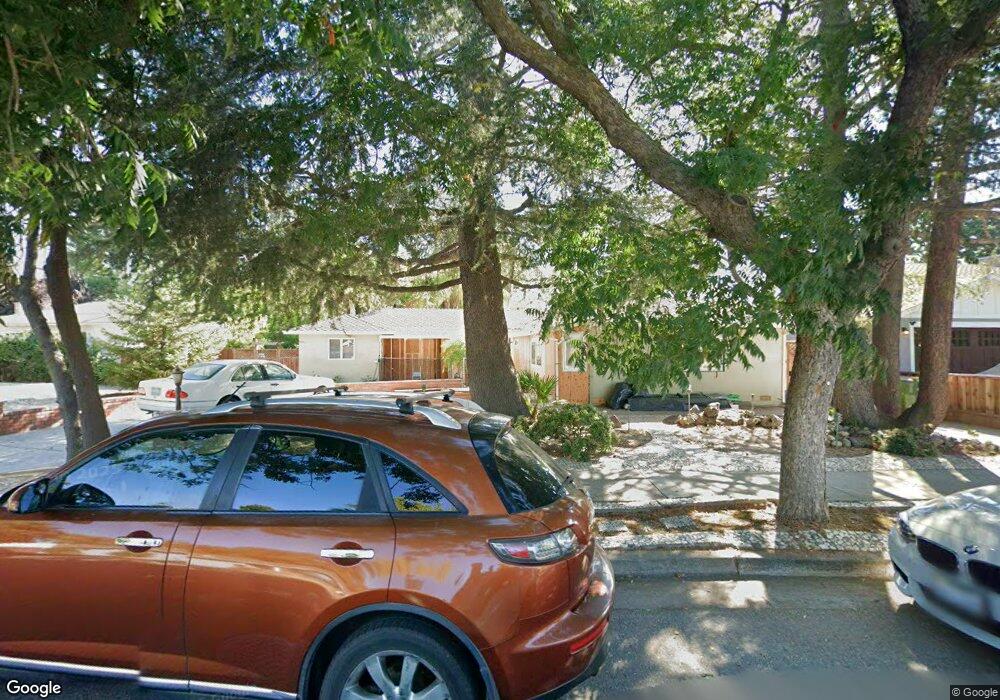
92 Catalpa Ln Campbell, CA 95008
Estimated Value: $2,238,000 - $2,729,000
4
Beds
4
Baths
1,679
Sq Ft
$1,432/Sq Ft
Est. Value
About This Home
This home is located at 92 Catalpa Ln, Campbell, CA 95008 and is currently estimated at $2,404,580, approximately $1,432 per square foot. 92 Catalpa Ln is a home located in Santa Clara County with nearby schools including Westmont High School, Campbell School of Innovation, and Capri Elementary.
Ownership History
Date
Name
Owned For
Owner Type
Purchase Details
Closed on
Apr 21, 2021
Sold by
Martin Scott and Martin Scott W
Bought by
Martin Scott
Current Estimated Value
Home Financials for this Owner
Home Financials are based on the most recent Mortgage that was taken out on this home.
Original Mortgage
$380,000
Interest Rate
3%
Mortgage Type
New Conventional
Purchase Details
Closed on
Apr 16, 2008
Sold by
Huan Haiyan
Bought by
Martin Scott W
Home Financials for this Owner
Home Financials are based on the most recent Mortgage that was taken out on this home.
Original Mortgage
$335,000
Interest Rate
5.99%
Mortgage Type
New Conventional
Purchase Details
Closed on
Jun 4, 1999
Sold by
Martin Scott W
Bought by
Martin Scott W
Home Financials for this Owner
Home Financials are based on the most recent Mortgage that was taken out on this home.
Original Mortgage
$100,000
Interest Rate
6.9%
Purchase Details
Closed on
May 11, 1998
Sold by
Dela Roche Charles L and Revocabl Viola R
Bought by
Martin Scott W
Create a Home Valuation Report for This Property
The Home Valuation Report is an in-depth analysis detailing your home's value as well as a comparison with similar homes in the area
Home Values in the Area
Average Home Value in this Area
Purchase History
| Date | Buyer | Sale Price | Title Company |
|---|---|---|---|
| Martin Scott | -- | Chicago Title Company | |
| Martin Scott W | -- | North American Title Co | |
| Martin Scott W | -- | Commonwealth Land Title Co | |
| Martin Scott W | -- | -- |
Source: Public Records
Mortgage History
| Date | Status | Borrower | Loan Amount |
|---|---|---|---|
| Closed | Martin Scott | $380,000 | |
| Closed | Martin Scott W | $335,000 | |
| Closed | Martin Scott W | $100,000 |
Source: Public Records
Tax History Compared to Growth
Tax History
| Year | Tax Paid | Tax Assessment Tax Assessment Total Assessment is a certain percentage of the fair market value that is determined by local assessors to be the total taxable value of land and additions on the property. | Land | Improvement |
|---|---|---|---|---|
| 2025 | $8,765 | $663,429 | $439,094 | $224,335 |
| 2024 | $8,765 | $647,050 | $430,485 | $216,565 |
| 2023 | $8,554 | $626,541 | $422,045 | $204,496 |
| 2022 | $7,915 | $564,227 | $413,770 | $150,457 |
| 2021 | $7,762 | $553,164 | $405,657 | $147,507 |
| 2020 | $7,556 | $547,493 | $401,498 | $145,995 |
| 2019 | $7,440 | $536,759 | $393,626 | $143,133 |
| 2018 | $7,207 | $526,235 | $385,908 | $140,327 |
| 2017 | $7,095 | $515,918 | $378,342 | $137,576 |
| 2016 | $6,671 | $505,803 | $370,924 | $134,879 |
| 2015 | $6,547 | $498,206 | $365,353 | $132,853 |
| 2014 | $6,285 | $488,448 | $358,197 | $130,251 |
Source: Public Records
Map
Nearby Homes
- 63 Braxton Terrace
- 203 Wilton Dr
- 120 Kennedy Ave
- 253 W Rincon Ave
- 195 Sunnyside Ave
- 186 E Rincon Ave
- 353 W Rincon Ave Unit E
- 99 Timber Cove Dr Unit 99
- 238 Railway Ave
- 21 N 2nd St Unit 306
- 21 N 2nd St Unit 303
- 110 S 1st St Unit 110
- 26 Timber Cove Dr Unit 26
- 88 La Paz Way Unit 88
- 283 Esther Ave
- 875 Emory Ave
- 341 Carlyn Ave
- 411 Dunster Dr
- 178 Salmar Terrace
- 375 N 3rd St Unit 3
- 106 Catalpa Ln
- 70 Catalpa Ln
- 89 El Caminito Ave
- 122 Catalpa Ln
- 103 El Caminito Ave
- 77 El Caminito Ave
- 91 Catalpa Ln
- 79 Catalpa Ln
- 121 El Caminito Ave
- 61 El Caminito Ave
- 105 Catalpa Ln
- 61 Catalpa Ln
- 50 Catalpa Ln
- 136 Catalpa Ln
- 121 Catalpa Ln
- 45 El Caminito Ave
- 46 Catalpa Ln
- 55 Catalpa Ln
- 150 Catalpa Ln
- 135 Catalpa Ln