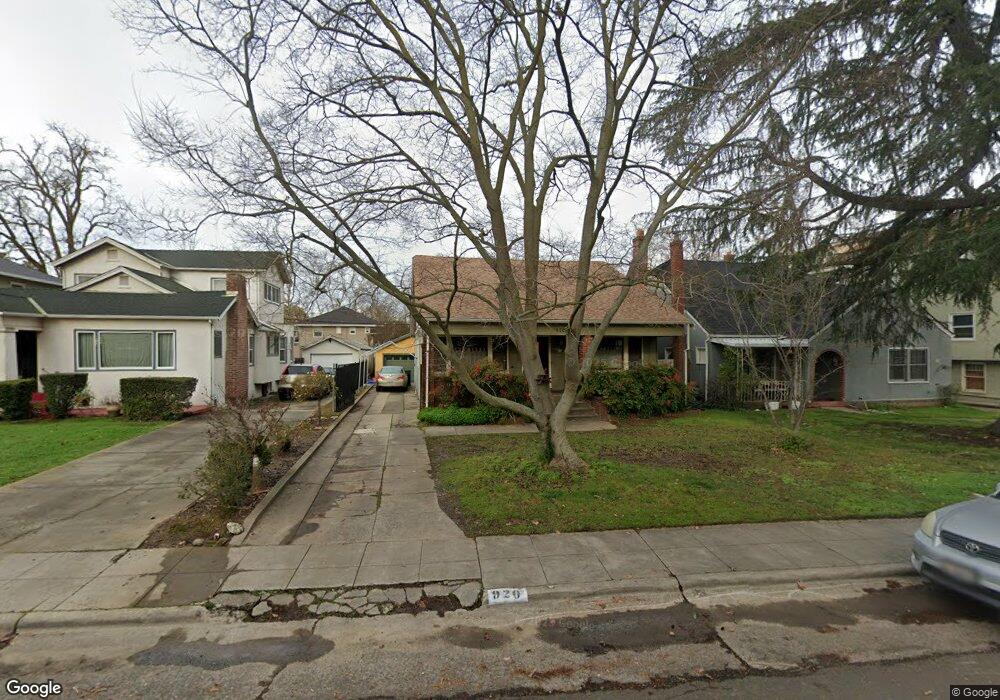
920 36th St Sacramento, CA 95816
East Sacramento NeighborhoodEstimated Value: $525,000 - $802,000
3
Beds
1
Bath
1,568
Sq Ft
$451/Sq Ft
Est. Value
About This Home
This home is located at 920 36th St, Sacramento, CA 95816 and is currently estimated at $706,780, approximately $450 per square foot. 920 36th St is a home located in Sacramento County with nearby schools including David Lubin Elementary, Miwok Middle School, and Hiram W. Johnson High School.
Ownership History
Date
Name
Owned For
Owner Type
Purchase Details
Closed on
Sep 25, 2013
Sold by
Faulkner David and Faulkner Cynthia L
Bought by
Faulkner David and Faulkner Cynthia Llano
Current Estimated Value
Purchase Details
Closed on
Apr 27, 1999
Sold by
Wall Patricia
Bought by
Faulkner David and Faulkner Cynthia L
Home Financials for this Owner
Home Financials are based on the most recent Mortgage that was taken out on this home.
Original Mortgage
$172,000
Outstanding Balance
$44,221
Interest Rate
6.98%
Estimated Equity
$662,559
Create a Home Valuation Report for This Property
The Home Valuation Report is an in-depth analysis detailing your home's value as well as a comparison with similar homes in the area
Home Values in the Area
Average Home Value in this Area
Purchase History
| Date | Buyer | Sale Price | Title Company |
|---|---|---|---|
| Faulkner David | -- | None Available | |
| Faulkner David | $215,000 | Stewart Title |
Source: Public Records
Mortgage History
| Date | Status | Borrower | Loan Amount |
|---|---|---|---|
| Open | Faulkner David | $172,000 |
Source: Public Records
Tax History Compared to Growth
Tax History
| Year | Tax Paid | Tax Assessment Tax Assessment Total Assessment is a certain percentage of the fair market value that is determined by local assessors to be the total taxable value of land and additions on the property. | Land | Improvement |
|---|---|---|---|---|
| 2025 | $3,991 | $337,038 | $109,728 | $227,310 |
| 2024 | $3,991 | $330,430 | $107,577 | $222,853 |
| 2023 | $3,897 | $323,952 | $105,468 | $218,484 |
| 2022 | $3,830 | $317,600 | $103,400 | $214,200 |
| 2021 | $3,650 | $311,373 | $101,373 | $210,000 |
| 2020 | $3,678 | $308,181 | $100,334 | $207,847 |
| 2019 | $3,600 | $302,139 | $98,367 | $203,772 |
| 2018 | $3,506 | $296,216 | $96,439 | $199,777 |
| 2017 | $3,457 | $290,409 | $94,549 | $195,860 |
| 2016 | $3,331 | $284,716 | $92,696 | $192,020 |
| 2015 | $3,282 | $280,440 | $91,304 | $189,136 |
| 2014 | $3,193 | $274,948 | $89,516 | $185,432 |
Source: Public Records
Map
Nearby Homes