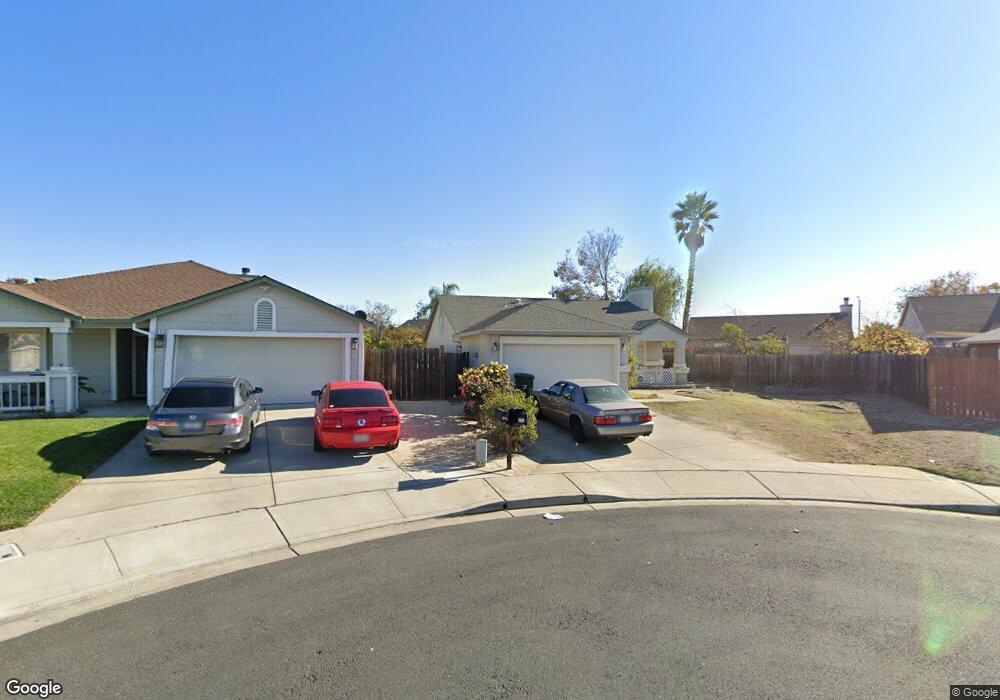
920 Forbes Ct Oakley, CA 94561
Estimated Value: $451,000 - $593,000
3
Beds
2
Baths
1,120
Sq Ft
$486/Sq Ft
Est. Value
About This Home
This home is located at 920 Forbes Ct, Oakley, CA 94561 and is currently estimated at $543,903, approximately $485 per square foot. 920 Forbes Ct is a home located in Contra Costa County with nearby schools including Vintage Parkway Elementary School, Delta Vista Middle School, and Freedom High School.
Ownership History
Date
Name
Owned For
Owner Type
Purchase Details
Closed on
Dec 22, 2011
Sold by
Dao Tri Minh
Bought by
Lan Haiyan and Xiong Ling
Current Estimated Value
Home Financials for this Owner
Home Financials are based on the most recent Mortgage that was taken out on this home.
Original Mortgage
$102,550
Outstanding Balance
$69,813
Interest Rate
3.91%
Mortgage Type
New Conventional
Estimated Equity
$474,090
Purchase Details
Closed on
Jan 8, 2002
Sold by
Pham Phoung Kim
Bought by
Dao Tri Minh
Home Financials for this Owner
Home Financials are based on the most recent Mortgage that was taken out on this home.
Original Mortgage
$188,800
Interest Rate
6%
Mortgage Type
Purchase Money Mortgage
Purchase Details
Closed on
May 14, 1999
Sold by
Pham Phuong Kim
Bought by
Dao Tri Minh
Home Financials for this Owner
Home Financials are based on the most recent Mortgage that was taken out on this home.
Original Mortgage
$155,207
Interest Rate
6.92%
Mortgage Type
Purchase Money Mortgage
Create a Home Valuation Report for This Property
The Home Valuation Report is an in-depth analysis detailing your home's value as well as a comparison with similar homes in the area
Home Values in the Area
Average Home Value in this Area
Purchase History
| Date | Buyer | Sale Price | Title Company |
|---|---|---|---|
| Lan Haiyan | $146,500 | Chicago Title Company | |
| Dao Tri Minh | -- | Commonwealth Land Title | |
| Dao Tri Minh | -- | Old Republic Title Company | |
| Dao Tri Minh | $167,500 | Old Republic Title Company |
Source: Public Records
Mortgage History
| Date | Status | Borrower | Loan Amount |
|---|---|---|---|
| Open | Lan Haiyan | $102,550 | |
| Previous Owner | Dao Tri Minh | $188,800 | |
| Previous Owner | Dao Tri Minh | $155,207 | |
| Closed | Dao Tri Minh | $23,600 |
Source: Public Records
Tax History Compared to Growth
Tax History
| Year | Tax Paid | Tax Assessment Tax Assessment Total Assessment is a certain percentage of the fair market value that is determined by local assessors to be the total taxable value of land and additions on the property. | Land | Improvement |
|---|---|---|---|---|
| 2025 | $3,071 | $184,000 | $43,956 | $140,044 |
| 2024 | $3,044 | $180,394 | $43,095 | $137,299 |
| 2023 | $3,044 | $176,857 | $42,250 | $134,607 |
| 2022 | $3,025 | $173,390 | $41,422 | $131,968 |
| 2021 | $2,963 | $169,991 | $40,610 | $129,381 |
| 2019 | $2,725 | $164,951 | $39,406 | $125,545 |
| 2018 | $2,668 | $161,718 | $38,634 | $123,084 |
| 2017 | $2,649 | $158,548 | $37,877 | $120,671 |
| 2016 | $2,527 | $155,440 | $37,135 | $118,305 |
| 2015 | $2,540 | $153,106 | $36,578 | $116,528 |
| 2014 | $2,506 | $150,108 | $35,862 | $114,246 |
Source: Public Records
Map
Nearby Homes
- 1126 Deerpark Rd
- 201 Ohara Ave
- 9999 7th St
- 336 Lakespring Place
- 321 Lakespring Place
- 0 Almond Dr Unit 41106452
- 4670 Fuschia Way
- 5053 Miguel Dr
- 0 Main St Unit 41115212
- 1384 Rutherford Ln
- 4545 Waterford Way
- 521 Freemark Ln
- 210 W Cypress Rd Unit 27
- 210 W Cypress Rd Unit 1
- 317 Lorenz Dr
- 354 Hazelnut Ln
- 881 Chianti Way
- 736 Walnut Ranch Way
- 3901-B Rose Ave
- 1809 Teresa Ln