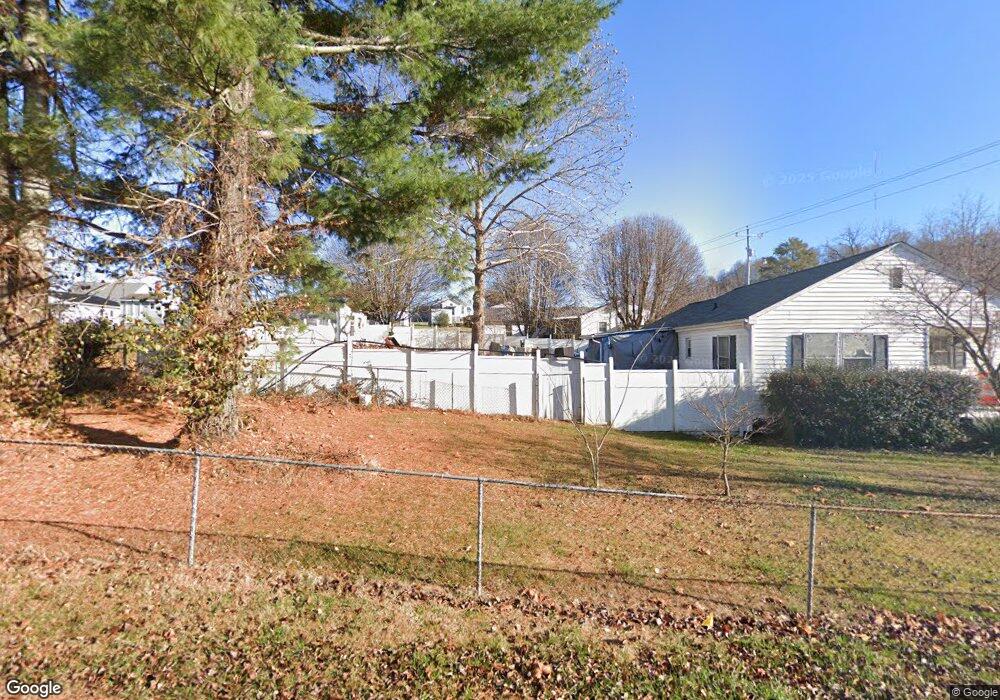
920 S 2nd St Elizabethton, TN 37643
Estimated Value: $171,514 - $238,000
--
Bed
1
Bath
1,328
Sq Ft
$157/Sq Ft
Est. Value
About This Home
This home is located at 920 S 2nd St, Elizabethton, TN 37643 and is currently estimated at $208,379, approximately $156 per square foot. 920 S 2nd St is a home located in Carter County with nearby schools including Elizabethton High School and East Tn Christian Home & Academy.
Ownership History
Date
Name
Owned For
Owner Type
Purchase Details
Closed on
Nov 14, 1997
Sold by
Montgomery Robert
Bought by
Morrison Douglas
Current Estimated Value
Home Financials for this Owner
Home Financials are based on the most recent Mortgage that was taken out on this home.
Original Mortgage
$64,560
Outstanding Balance
$10,586
Interest Rate
7.27%
Estimated Equity
$197,793
Purchase Details
Closed on
Jan 1, 1986
Bought by
Montgomery Robert L and Montgomery Lana S
Create a Home Valuation Report for This Property
The Home Valuation Report is an in-depth analysis detailing your home's value as well as a comparison with similar homes in the area
Home Values in the Area
Average Home Value in this Area
Purchase History
| Date | Buyer | Sale Price | Title Company |
|---|---|---|---|
| Morrison Douglas | $64,900 | -- | |
| Montgomery Robert L | $24,900 | -- |
Source: Public Records
Mortgage History
| Date | Status | Borrower | Loan Amount |
|---|---|---|---|
| Open | Montgomery Robert L | $64,560 |
Source: Public Records
Tax History Compared to Growth
Tax History
| Year | Tax Paid | Tax Assessment Tax Assessment Total Assessment is a certain percentage of the fair market value that is determined by local assessors to be the total taxable value of land and additions on the property. | Land | Improvement |
|---|---|---|---|---|
| 2024 | $850 | $25,750 | $6,925 | $18,825 |
| 2023 | $850 | $25,750 | $0 | $0 |
| 2022 | $927 | $25,750 | $6,925 | $18,825 |
| 2021 | $523 | $25,750 | $6,925 | $18,825 |
| 2020 | $852 | $25,750 | $6,925 | $18,825 |
| 2019 | $852 | $19,725 | $3,900 | $15,825 |
| 2018 | $840 | $19,725 | $3,900 | $15,825 |
| 2017 | $840 | $19,725 | $3,900 | $15,825 |
| 2016 | $836 | $19,725 | $3,900 | $15,825 |
| 2015 | $838 | $19,725 | $3,900 | $15,825 |
| 2014 | $838 | $19,625 | $3,900 | $15,725 |
Source: Public Records
Map
Nearby Homes