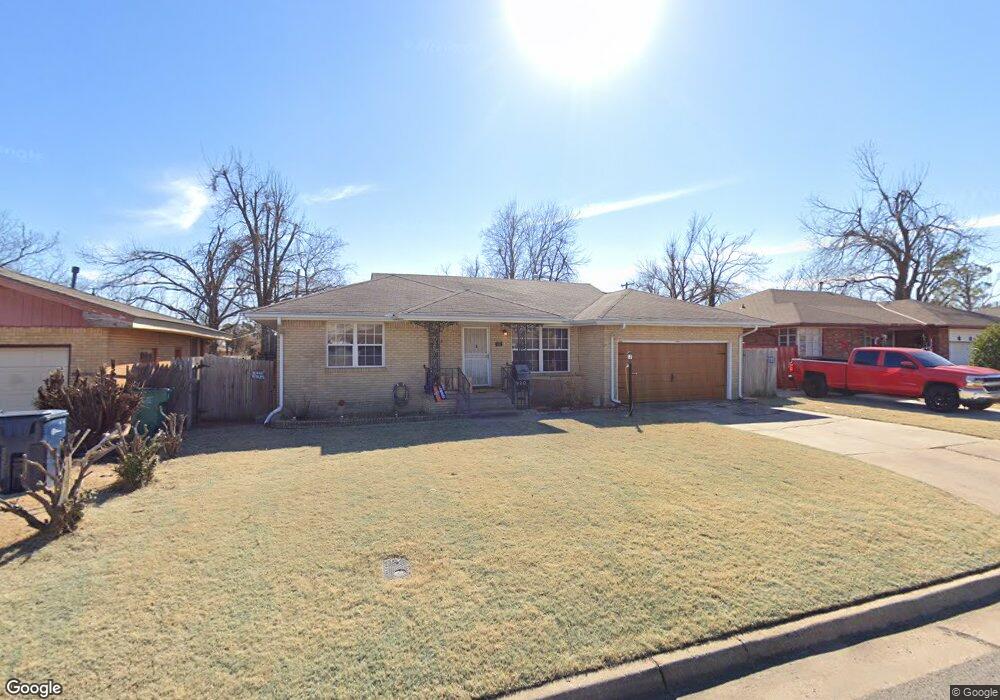
920 SW 45th St Oklahoma City, OK 73109
Highlander Community South NeighborhoodEstimated Value: $124,155 - $161,000
2
Beds
1
Bath
1,189
Sq Ft
$117/Sq Ft
Est. Value
About This Home
This home is located at 920 SW 45th St, Oklahoma City, OK 73109 and is currently estimated at $138,539, approximately $116 per square foot. 920 SW 45th St is a home located in Oklahoma County with nearby schools including Fillmore Elementary School, Webster Middle School, and Capitol Hill High School.
Ownership History
Date
Name
Owned For
Owner Type
Purchase Details
Closed on
Jan 8, 2019
Sold by
Schrott Loree
Bought by
Wood Angela
Current Estimated Value
Purchase Details
Closed on
Dec 7, 2005
Sold by
Wood Angela
Bought by
Wood Angela and Schrott Loree
Purchase Details
Closed on
Nov 21, 2003
Sold by
Owens Julie Ann
Bought by
Wood Angela
Home Financials for this Owner
Home Financials are based on the most recent Mortgage that was taken out on this home.
Original Mortgage
$51,600
Interest Rate
10.2%
Mortgage Type
Purchase Money Mortgage
Purchase Details
Closed on
Nov 7, 2003
Sold by
Davis Laurie Mae and Davis Todd
Bought by
Owens Julie Ann
Home Financials for this Owner
Home Financials are based on the most recent Mortgage that was taken out on this home.
Original Mortgage
$51,600
Interest Rate
10.2%
Mortgage Type
Purchase Money Mortgage
Purchase Details
Closed on
Mar 24, 2000
Sold by
Davis Laurie M
Bought by
Owens Julie Ann
Create a Home Valuation Report for This Property
The Home Valuation Report is an in-depth analysis detailing your home's value as well as a comparison with similar homes in the area
Home Values in the Area
Average Home Value in this Area
Purchase History
| Date | Buyer | Sale Price | Title Company |
|---|---|---|---|
| Wood Angela | -- | None Available | |
| Wood Angela | -- | Nations Title | |
| Wood Angela | $64,500 | Nations Title Of Okc | |
| Owens Julie Ann | -- | Nations Title Of Okc | |
| Owens Julie Ann | $14,500 | -- |
Source: Public Records
Mortgage History
| Date | Status | Borrower | Loan Amount |
|---|---|---|---|
| Previous Owner | Wood Angela | $51,600 |
Source: Public Records
Tax History Compared to Growth
Tax History
| Year | Tax Paid | Tax Assessment Tax Assessment Total Assessment is a certain percentage of the fair market value that is determined by local assessors to be the total taxable value of land and additions on the property. | Land | Improvement |
|---|---|---|---|---|
| 2024 | $898 | $8,851 | $1,438 | $7,413 |
| 2023 | $898 | $8,593 | $1,593 | $7,000 |
| 2022 | $827 | $8,343 | $1,488 | $6,855 |
| 2021 | $797 | $8,100 | $1,684 | $6,416 |
| 2020 | $778 | $7,865 | $1,794 | $6,071 |
| 2019 | $808 | $8,157 | $1,786 | $6,371 |
| 2018 | $783 | $7,920 | $0 | $0 |
| 2017 | $774 | $7,845 | $1,598 | $6,247 |
| 2016 | $749 | $7,616 | $1,584 | $6,032 |
| 2015 | $731 | $7,394 | $1,613 | $5,781 |
| 2014 | $767 | $7,754 | $1,648 | $6,106 |
Source: Public Records
Map
Nearby Homes
- 1112 SW 45th St
- 4406 S Olie Ave
- 644 SW 44th St
- 1125 SW 47th St
- 1134 SW 42nd St
- 628 SW 43rd St
- 629 SW 46th St
- 8 SW 41st St
- 325 SW 40th St
- 624 SW 44th St
- 623 SW 48th St
- 4312 S Lee Ave
- 537 SW 45th St
- 1116 SW 38th St
- 1300 SW 46th St
- 1232 SW 48th St
- 1313 SW 45th St
- 516 SW 46th St
- 1321 Williams Dr
- 1004 SW 53rd St