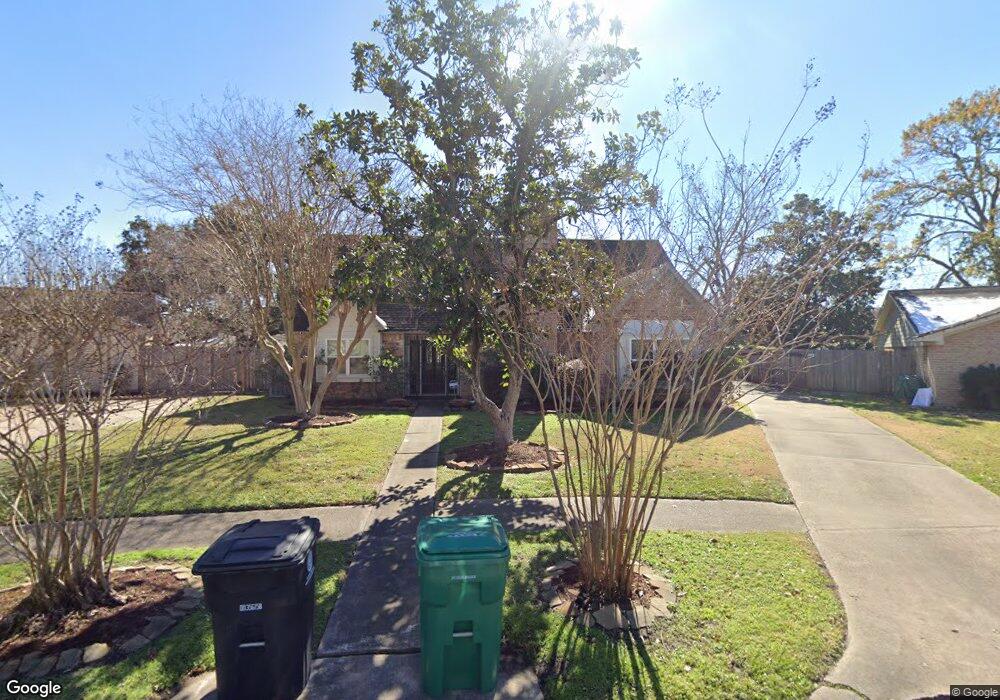
9203 Langdon Ln Houston, TX 77036
Chinatown NeighborhoodEstimated Value: $330,000 - $355,991
4
Beds
3
Baths
2,259
Sq Ft
$152/Sq Ft
Est. Value
About This Home
This home is located at 9203 Langdon Ln, Houston, TX 77036 and is currently estimated at $342,998, approximately $151 per square foot. 9203 Langdon Ln is a home located in Harris County with nearby schools including Ed White Elementary School, Sugar Grove Academy, and Sharpstown High School.
Ownership History
Date
Name
Owned For
Owner Type
Purchase Details
Closed on
Dec 28, 1998
Sold by
Nunn Richard A and Nunn Judy W
Bought by
Su Robert M and Hoang Hoa N
Current Estimated Value
Home Financials for this Owner
Home Financials are based on the most recent Mortgage that was taken out on this home.
Original Mortgage
$125,100
Outstanding Balance
$29,416
Interest Rate
6.92%
Estimated Equity
$313,582
Create a Home Valuation Report for This Property
The Home Valuation Report is an in-depth analysis detailing your home's value as well as a comparison with similar homes in the area
Home Values in the Area
Average Home Value in this Area
Purchase History
| Date | Buyer | Sale Price | Title Company |
|---|---|---|---|
| Su Robert M | -- | Charter Title Company |
Source: Public Records
Mortgage History
| Date | Status | Borrower | Loan Amount |
|---|---|---|---|
| Open | Su Robert M | $125,100 |
Source: Public Records
Tax History Compared to Growth
Tax History
| Year | Tax Paid | Tax Assessment Tax Assessment Total Assessment is a certain percentage of the fair market value that is determined by local assessors to be the total taxable value of land and additions on the property. | Land | Improvement |
|---|---|---|---|---|
| 2025 | $3,772 | $293,000 | $117,200 | $175,800 |
| 2024 | $3,772 | $276,757 | $117,200 | $159,557 |
| 2023 | $3,772 | $317,715 | $117,200 | $200,515 |
| 2022 | $5,429 | $254,579 | $68,367 | $186,212 |
| 2021 | $5,041 | $216,282 | $58,600 | $157,682 |
| 2020 | $5,178 | $207,000 | $58,600 | $148,400 |
| 2019 | $5,404 | $207,000 | $58,600 | $148,400 |
| 2018 | $3,686 | $196,000 | $58,600 | $137,400 |
| 2017 | $4,659 | $212,111 | $58,600 | $153,511 |
| 2016 | $4,236 | $184,000 | $58,600 | $125,400 |
| 2015 | $2,595 | $159,357 | $58,600 | $100,757 |
| 2014 | $2,595 | $159,357 | $58,600 | $100,757 |
Source: Public Records
Map
Nearby Homes
- 7939 Kendalia Dr
- 9234 Westwood Village Dr Unit 17
- 9345 Westwood Village Dr Unit 30
- 9215 Sharpcrest St
- 9393 Westwood Village Dr Unit 64
- 9506 Hendon Ln
- 8923 Hendon Ln
- 8902 Langdon Ln
- 9002 Grape St
- 8918 Grape St
- 9238 Stroud Dr
- 8826 Tanager St
- 8326 Jorine Dr Unit 8326
- 8334 Jorine Dr Unit 8733
- 9006 Roos Rd
- 8931 Jackwood St
- 8360 Jorine Dr Unit 8360
- 9901 Sharpcrest St Unit K3
- 9901 Sharpcrest St Unit M6
- 9901 Sharpcrest St Unit F3
- 7719 Lacy Hill Dr
- 7871 Kendalia Dr
- 7881 Kendalia Dr
- 7881 Kendalia Dr
- 9207 Langdon Ln
- 7873 Kendalia Dr
- 7873 Kendalia Dr Unit 29
- 7879 Kendalia Dr
- 7875 Kendalia Dr
- 7877 Kendalia Dr
- 7715 Lacy Hill Dr
- 9211 Langdon Ln
- 7897 Kendalia Dr
- 7893 Kendalia Dr
- 7891 Kendalia Dr
- 7895 Kendalia Dr
- 7718 Lacy Hill Dr
- 7889 Kendalia Dr
- 7883 Kendalia Dr
- 7885 Kendalia Dr