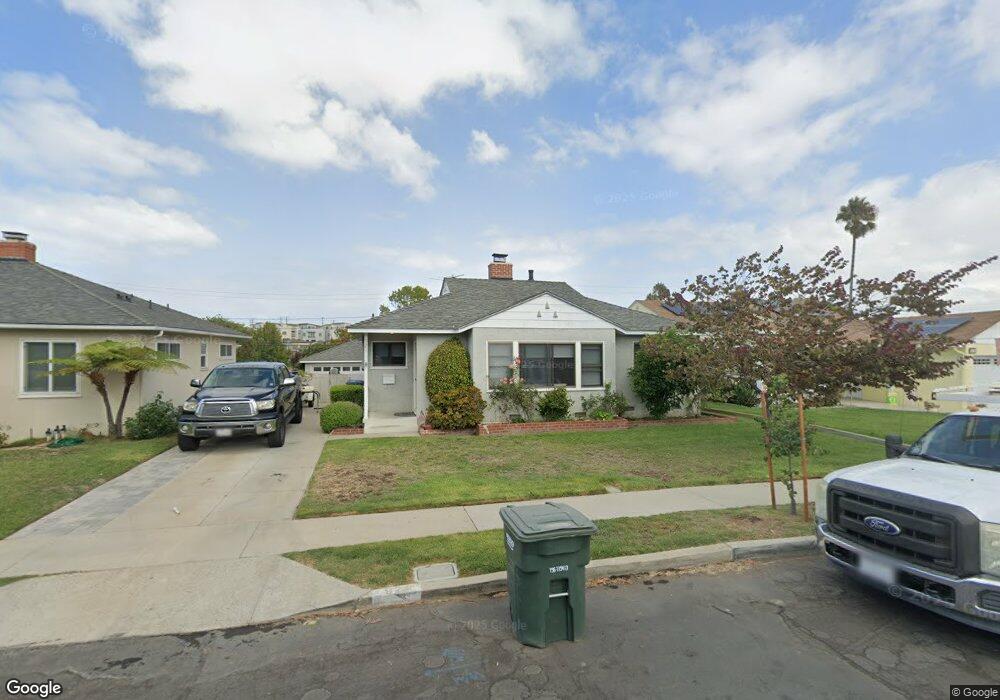
921 Lomita St El Segundo, CA 90245
Estimated Value: $1,473,000 - $1,699,632
2
Beds
2
Baths
1,219
Sq Ft
$1,299/Sq Ft
Est. Value
About This Home
This home is located at 921 Lomita St, El Segundo, CA 90245 and is currently estimated at $1,583,408, approximately $1,298 per square foot. 921 Lomita St is a home located in Los Angeles County with nearby schools including Center Street Elementary, El Segundo Middle School, and El Segundo High School.
Ownership History
Date
Name
Owned For
Owner Type
Purchase Details
Closed on
Feb 20, 2019
Sold by
Marinelli Samuel Lee
Bought by
Marinelli Samuel L and Samuel L Marinelli Sr Trust
Current Estimated Value
Purchase Details
Closed on
Oct 29, 1997
Sold by
Marinelli Sam and Marinelli Sharon A
Bought by
Marinelli Samuel Lee
Purchase Details
Closed on
Aug 1, 1994
Sold by
Marinelli Sam
Bought by
Marinelli Sam and Marinelli Sharon Ann
Purchase Details
Closed on
May 3, 1994
Sold by
Tetu Floyd J
Bought by
Marinelli Sam
Home Financials for this Owner
Home Financials are based on the most recent Mortgage that was taken out on this home.
Original Mortgage
$225,000
Outstanding Balance
$115,034
Interest Rate
7.84%
Estimated Equity
$1,468,374
Create a Home Valuation Report for This Property
The Home Valuation Report is an in-depth analysis detailing your home's value as well as a comparison with similar homes in the area
Home Values in the Area
Average Home Value in this Area
Purchase History
| Date | Buyer | Sale Price | Title Company |
|---|---|---|---|
| Marinelli Samuel L | -- | None Available | |
| Marinelli Samuel Lee | -- | -- | |
| Marinelli Sam | -- | -- | |
| Marinelli Sam | $250,000 | Investors Title Company | |
| Marinelli Sam | -- | Investors Title Company |
Source: Public Records
Mortgage History
| Date | Status | Borrower | Loan Amount |
|---|---|---|---|
| Open | Marinelli Sam | $225,000 |
Source: Public Records
Tax History Compared to Growth
Tax History
| Year | Tax Paid | Tax Assessment Tax Assessment Total Assessment is a certain percentage of the fair market value that is determined by local assessors to be the total taxable value of land and additions on the property. | Land | Improvement |
|---|---|---|---|---|
| 2025 | $10,511 | $943,056 | $786,279 | $156,777 |
| 2024 | $10,511 | $924,565 | $770,862 | $153,703 |
| 2023 | $10,186 | $906,438 | $755,748 | $150,690 |
| 2022 | $4,735 | $405,591 | $320,319 | $85,272 |
| 2021 | $4,718 | $397,639 | $314,039 | $83,600 |
| 2019 | $4,509 | $385,846 | $304,725 | $81,121 |
| 2018 | $4,191 | $378,281 | $298,750 | $79,531 |
| 2016 | $4,062 | $363,594 | $287,150 | $76,444 |
| 2015 | $4,011 | $358,133 | $282,837 | $75,296 |
| 2014 | $3,932 | $351,119 | $277,297 | $73,822 |
Source: Public Records
Map
Nearby Homes
- 906 E Imperial Ave
- 848 Penn St
- 574 E Imperial Ave
- 926 Fairing Place
- 876 Center St
- 1112 E Imperial Ave
- 1116 E Imperial Ave
- 426 E Imperial Ave
- 1261 E Maple Ave
- 212 E Imperial Ave Unit A
- 212 E Imperial Ave Unit E
- 608 Lomita St
- 935 Main St Unit 303
- 516 Penn St
- 1510 E Maple Ave
- 1514 E Maple Ave
- 745 Main St Unit 107
- 1630 E Palm Ave Unit 5
- 955 Virginia St
- 1225 E Grand Ave Unit B