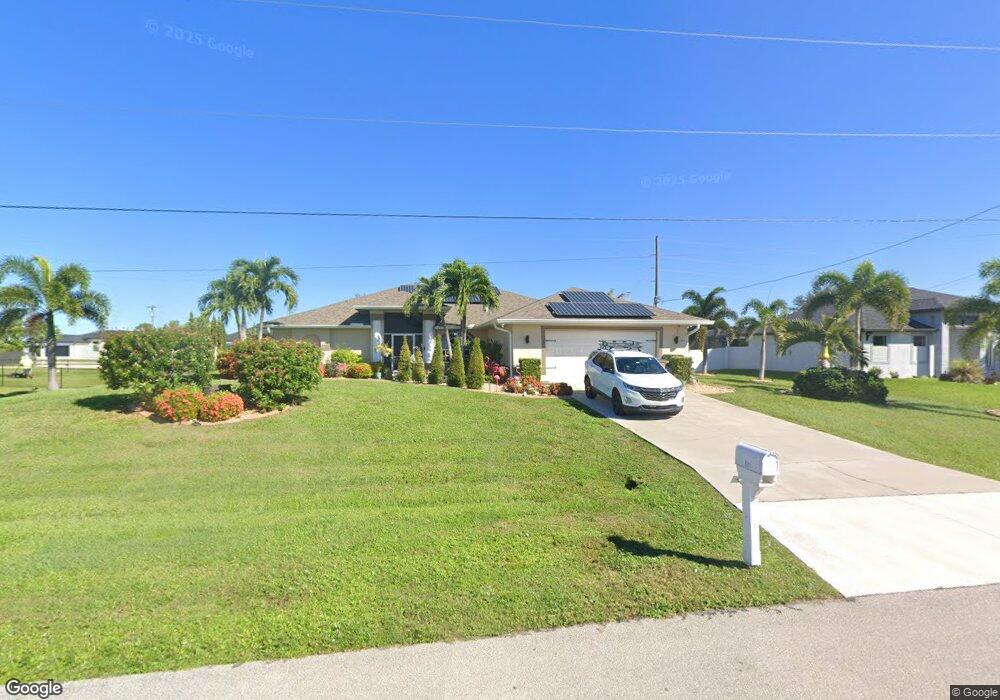
921 SW Embers Terrace Cape Coral, FL 33991
Mariner NeighborhoodEstimated Value: $386,522 - $487,000
4
Beds
3
Baths
2,943
Sq Ft
$155/Sq Ft
Est. Value
About This Home
This home is located at 921 SW Embers Terrace, Cape Coral, FL 33991 and is currently estimated at $455,131, approximately $154 per square foot. 921 SW Embers Terrace is a home located in Lee County with nearby schools including Caloosa Elementary School, Tropic Isles Elementary School, and J. Colin English Elementary School.
Ownership History
Date
Name
Owned For
Owner Type
Purchase Details
Closed on
Jun 17, 2010
Sold by
Polverino Victor
Bought by
Madden Louis and Madden Lu Ann
Current Estimated Value
Home Financials for this Owner
Home Financials are based on the most recent Mortgage that was taken out on this home.
Original Mortgage
$106,400
Outstanding Balance
$71,099
Interest Rate
4.91%
Mortgage Type
New Conventional
Estimated Equity
$384,032
Purchase Details
Closed on
Jun 30, 2005
Sold by
The Firm Investment Group Inc
Bought by
Polverino Victor
Home Financials for this Owner
Home Financials are based on the most recent Mortgage that was taken out on this home.
Original Mortgage
$312,200
Interest Rate
7.25%
Mortgage Type
Construction
Purchase Details
Closed on
Dec 16, 2004
Sold by
Brunnell Helen K
Bought by
The Firm Investment Group Inc
Create a Home Valuation Report for This Property
The Home Valuation Report is an in-depth analysis detailing your home's value as well as a comparison with similar homes in the area
Home Values in the Area
Average Home Value in this Area
Purchase History
| Date | Buyer | Sale Price | Title Company |
|---|---|---|---|
| Madden Louis | $133,000 | Progressive Title Inc | |
| Polverino Victor | $83,000 | Safe Harbor Title Company | |
| The Firm Investment Group Inc | $6,840 | -- |
Source: Public Records
Mortgage History
| Date | Status | Borrower | Loan Amount |
|---|---|---|---|
| Open | Madden Louis | $106,400 | |
| Previous Owner | Polverino Victor | $312,200 |
Source: Public Records
Tax History Compared to Growth
Tax History
| Year | Tax Paid | Tax Assessment Tax Assessment Total Assessment is a certain percentage of the fair market value that is determined by local assessors to be the total taxable value of land and additions on the property. | Land | Improvement |
|---|---|---|---|---|
| 2025 | $4,518 | $310,696 | -- | -- |
| 2024 | $4,358 | $272,746 | -- | -- |
| 2023 | $4,358 | $259,802 | $0 | $0 |
| 2022 | $4,163 | $257,089 | $0 | $0 |
| 2021 | $4,273 | $265,478 | $14,000 | $251,478 |
| 2020 | $4,338 | $246,155 | $0 | $0 |
| 2019 | $4,210 | $240,621 | $12,000 | $228,621 |
| 2018 | $4,322 | $242,404 | $0 | $0 |
| 2017 | $4,303 | $237,418 | $8,000 | $229,418 |
| 2016 | $4,062 | $207,980 | $8,000 | $199,980 |
| 2015 | $3,788 | $186,989 | $8,000 | $178,989 |
| 2014 | -- | $171,500 | $6,100 | $165,400 |
| 2013 | -- | $160,512 | $5,100 | $155,412 |
Source: Public Records
Map
Nearby Homes
- 913 Embers Pkwy W
- 1220 SE 23rd Place
- PRESCOTT Plan at Cape Coral - Signature
- QUINCY Plan at Cape Coral - Signature
- 1246 Block Plan at Cape Coral - Signature
- 12 NW 10 Ave
- 1029 Embers Pkwy W
- 27 SW 8th Place
- 1017 SW 1st St
- 127 SW 10th Ave
- 129 SW 9th Place
- 8 Nelson Rd N
- 1041 Embers Pkwy W
- 1032 SW 1st St
- 143 Nelson Rd N
- 133 SW 8th Place
- 209 SW 10th Place
- 121 NW 10th Ave
- 212 SW 10th Ave
- 217 SW 10th Ave
- 915 SW Embers Terrace
- 927 SW Embers Terrace
- 918 Embers Pkwy W
- 922 Embers Pkwy W
- 926 Embers Pkwy W
- 910 Embers Pkwy
- 1003 SW Embers Terrace
- 1002 Embers Pkwy W
- 922 SW Embers Terrace
- 907 SW Embers Terrace
- 926 SW Embers Terrace
- 904 SW Embers Terrace
- 1006 Embers Pkwy W
- 1006 Embers Pkwy
- 917 NW Embers Terrace
- 917 Embers Pkwy W
- 930 SW Embers Terrace
- 921 Embers Pkwy W Unit 45+46
- 913 NW Embers Terrace
- 900 SW Embers Terrace Unit 48